Validate Tracing Instrumentation
Overview
Use this guide to confirm that your application is correctly instrumented with OpenTelemetry and that traces are arriving in CtrlB.
Prerequisites
- Your application is instrumented with an official OpenTelemetry SDK/auto-instrumentation for your language.
- Your OpenTelemetry exporter or Collector is configured to send OTLP data to CtrlB. See: OpenTelemetry Collector for Traces
Generate traffic
Applications will not produce traces unless they are being interacted with. OpenTelemetry exports data periodically and often buffers before sending. To verify traces:
- Start your application.
- Trigger an action that generates a request (for example, hit a service endpoint a few times or load a page that calls your backend).
- Wait a short period (typically 15–60 seconds) for spans to be batched and exported.
Validate in CtrlB
Use the Services and Traces pages to confirm that data is flowing.
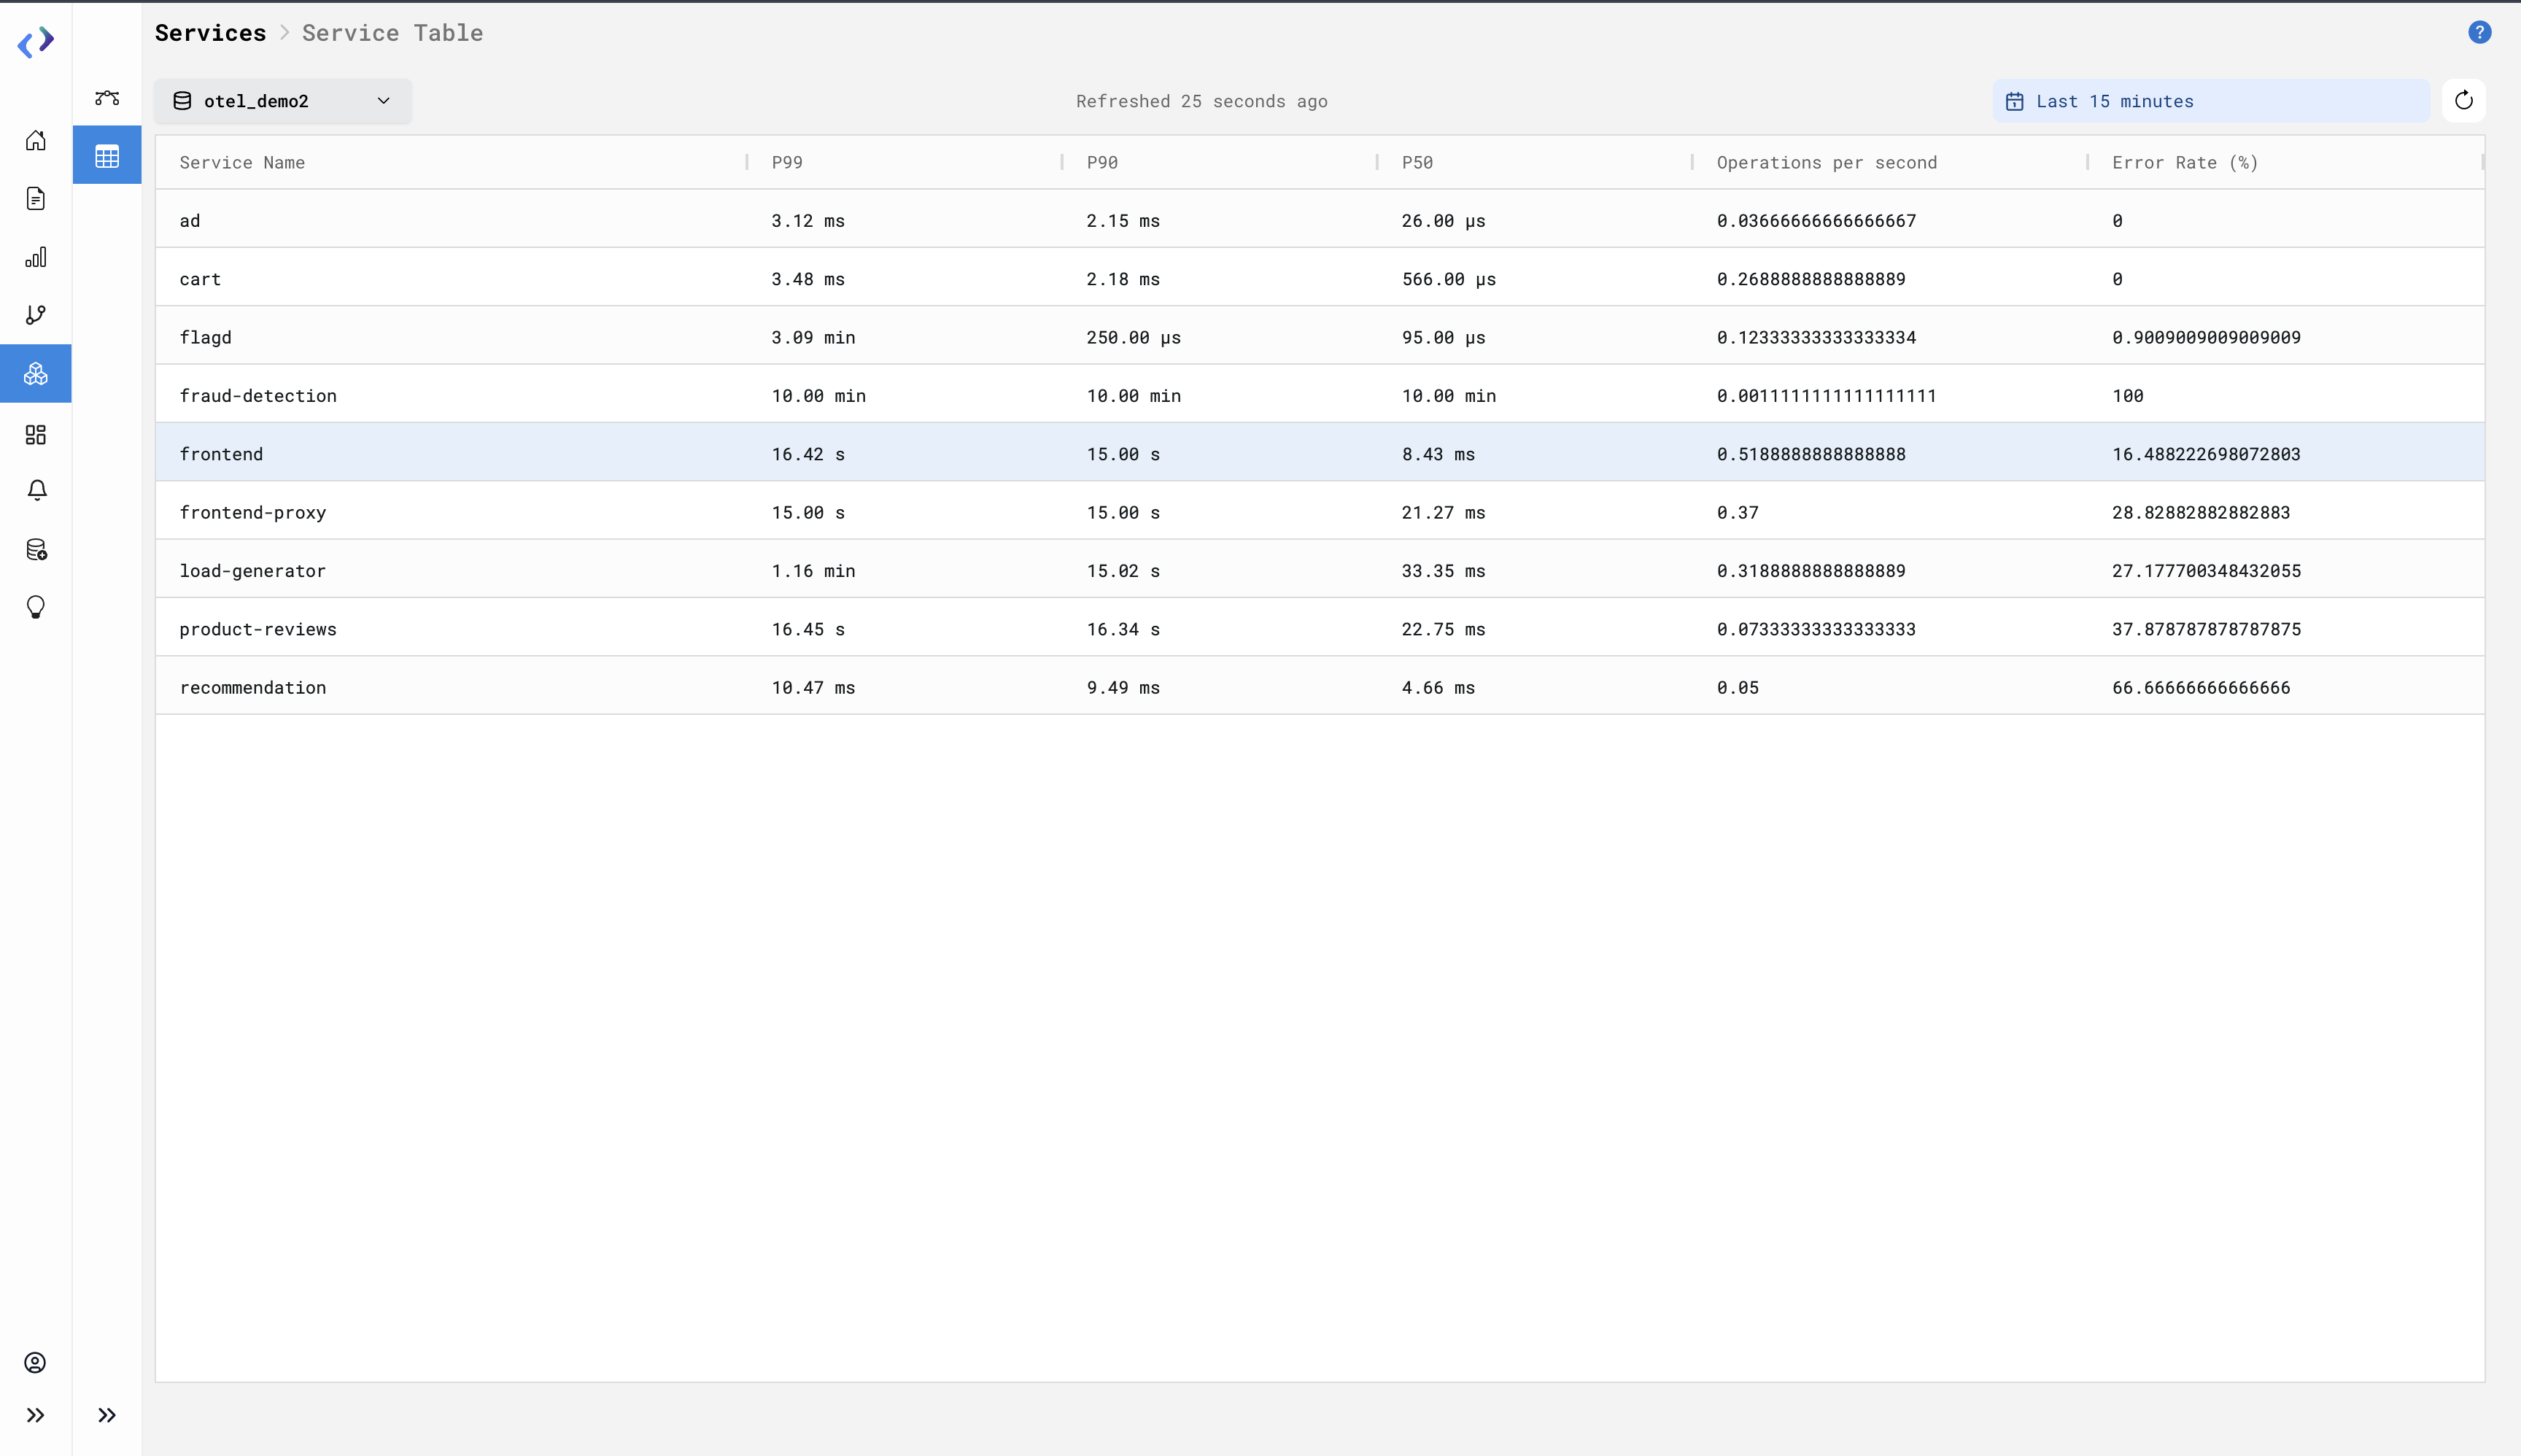
1. Services page — Open the Services page. Set an appropriate time range (e.g. Last 15 minutes). Your service appears here once CtrlB receives its first spans. Click Refresh if you don't see it immediately.
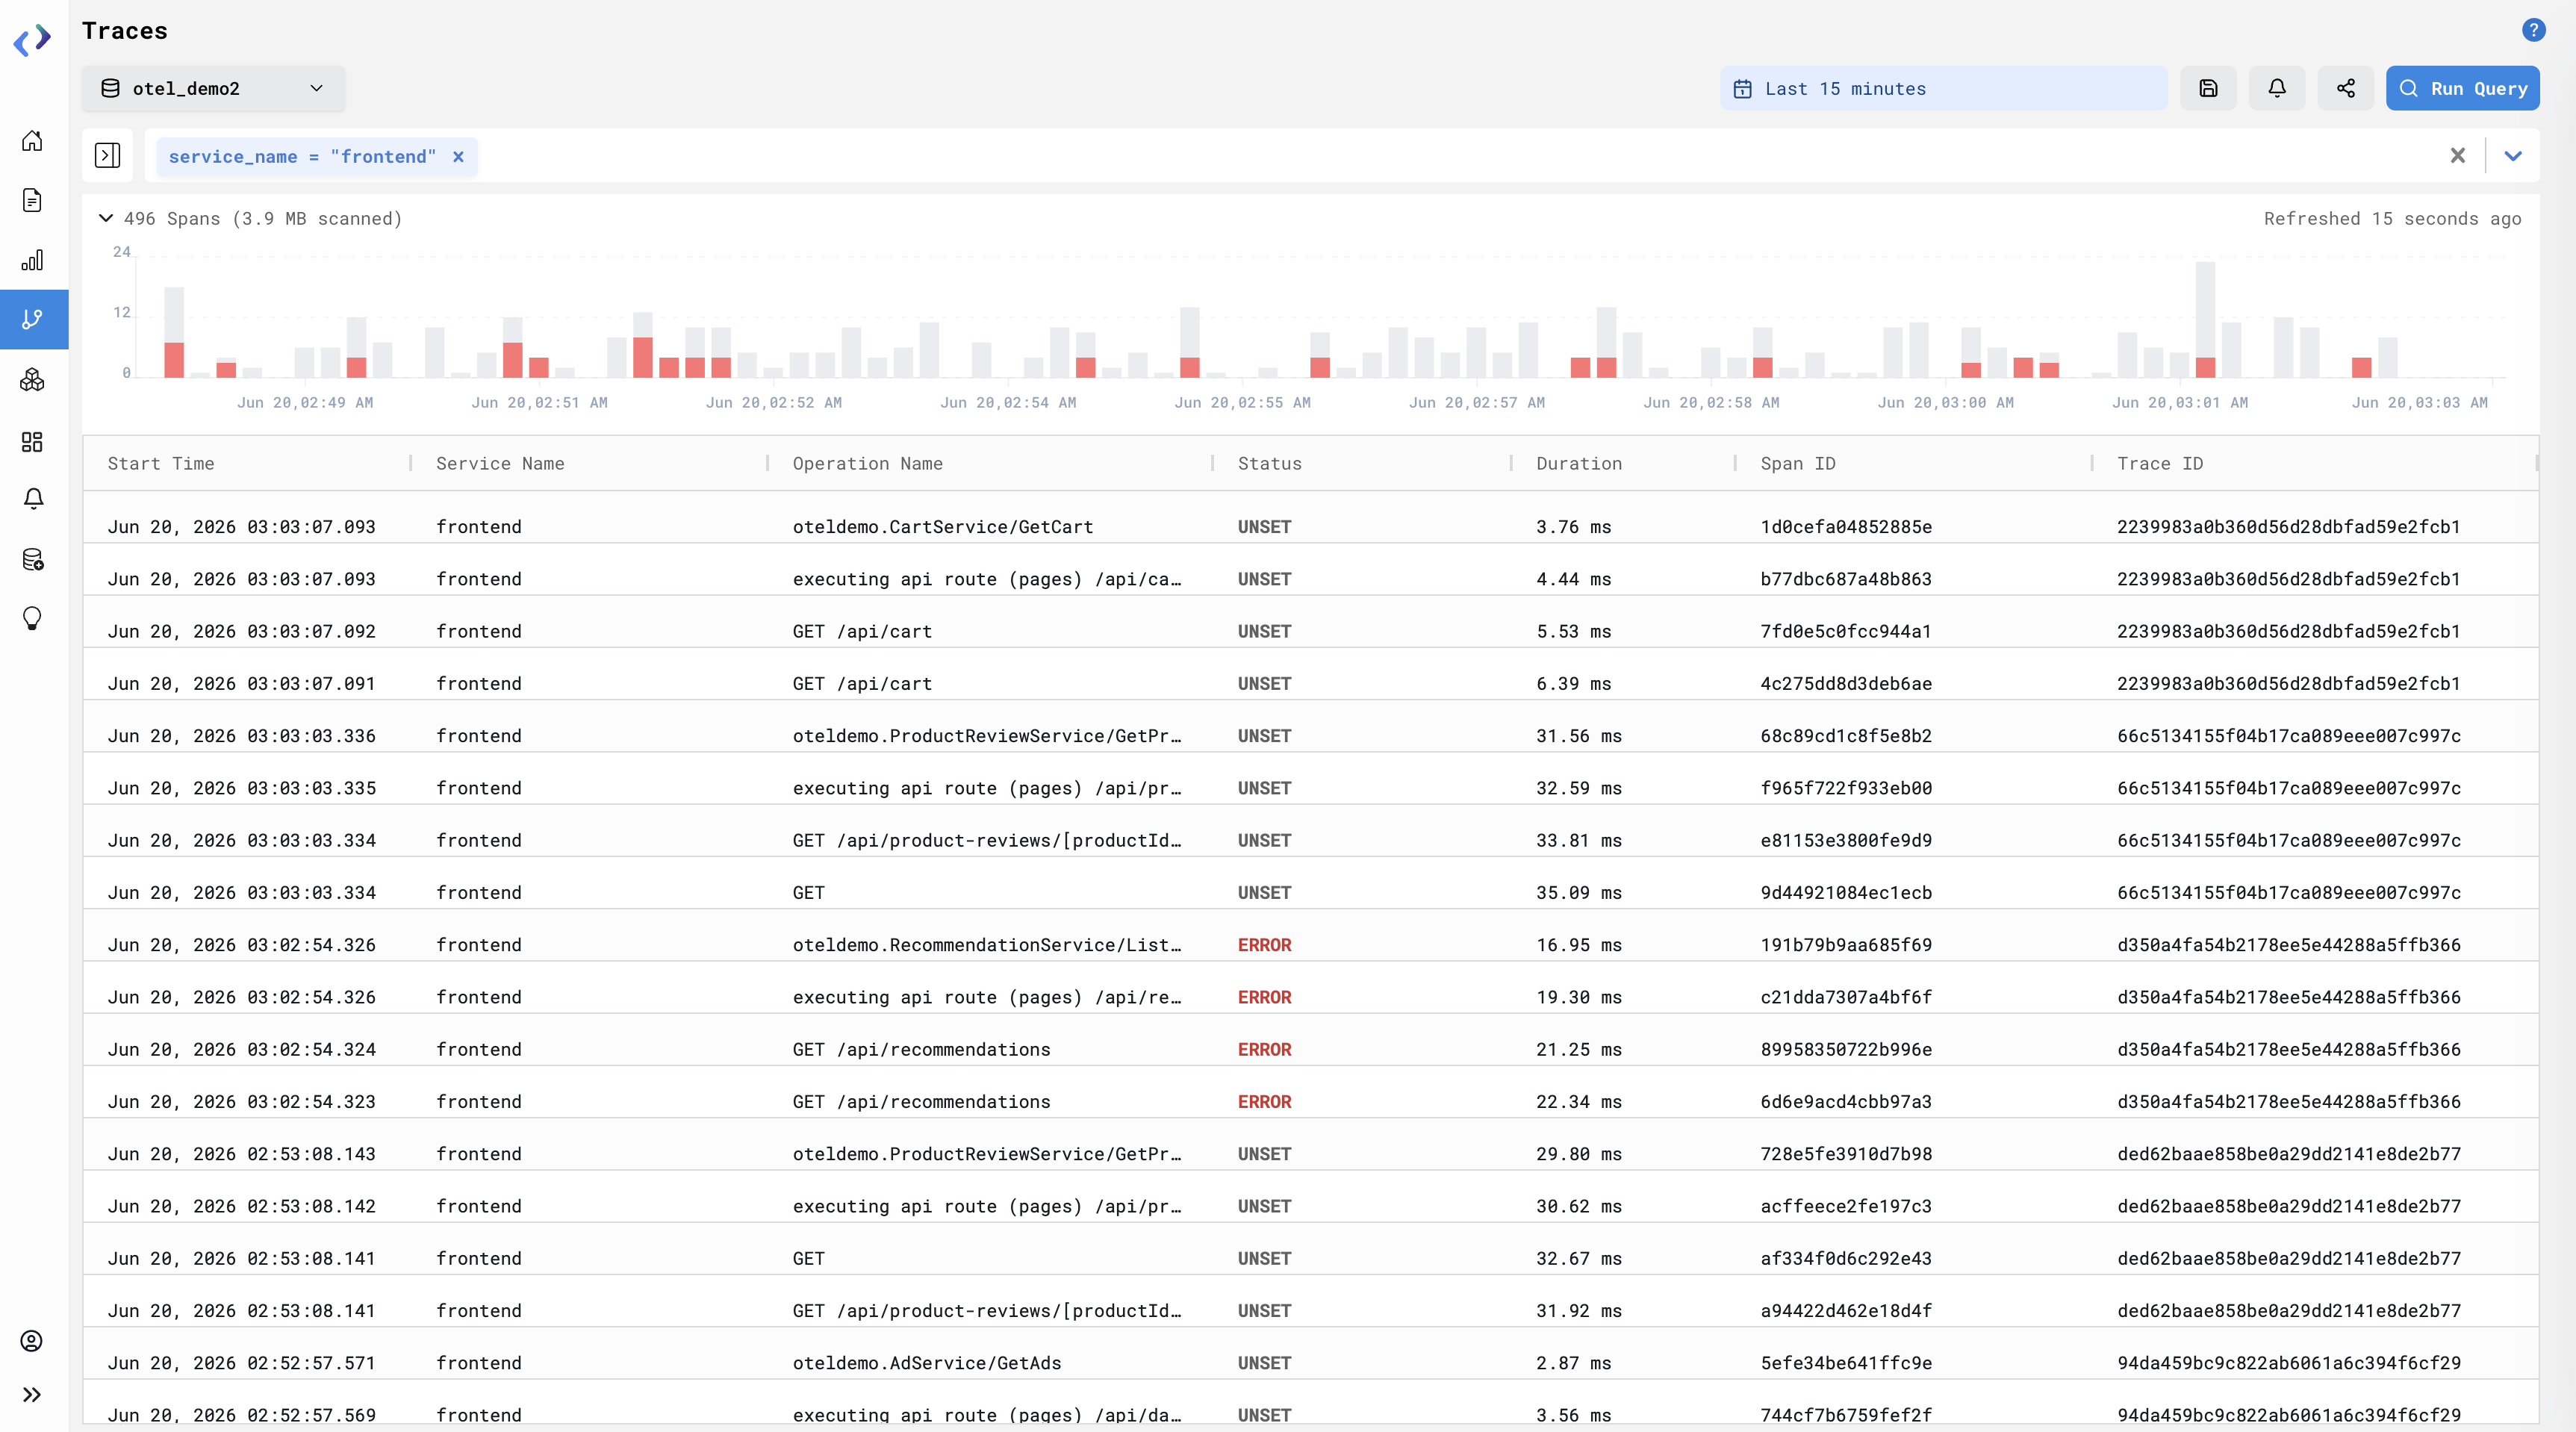
2. Traces page — Open the Traces page. Set an appropriate time range (e.g. Last 15 minutes) and filter by your service name and other relevant attributes. You should see recent traces from your instrumented application.
Troubleshooting
Common issues
Service not listed in CtrlB
- Ensure your service name (e.g.
OTEL_SERVICE_NAME) is set before the application starts. - Use no spaces or invalid characters in the service name.
No spans received
| Check | Explanation |
|---|---|
OTEL_EXPORTER_OTLP_PROTOCOL=http/protobuf | Required by CtrlB. |
| Ingestion endpoint has no trailing slash | e.g. https://ingest.ctrlb.dev. |
Headers include both Authorization and stream-name | Most common issue. |
| Machine can reach CtrlB ingestion endpoint | Check firewall/VPC rules. |
Test network connectivity:
curl -v https://<INGESTION_HOST>
Agent not applied (e.g. Java)
- The path to the agent JAR is wrong, or the agent argument is in the wrong place (it must come before the
-jarargument).
Proxy / SSL issues
If you're behind a corporate proxy, set -DproxyHost=<host> and -DproxyPort=<port> (or the equivalent for your SDK).
If you still don't see traces
- Confirm the OTLP endpoint, protocol, and auth settings match your CtrlB workspace/Collector configuration.
- Ensure your application actually executed instrumented code paths (generate more traffic if uncertain).
- Increase the time range and click Refresh on Services/Traces pages.
- Check the OpenTelemetry SDK/agent logs and your Collector logs for export or connection errors.
- Verify any network egress rules, proxies, or firewalls allow traffic to the CtrlB endpoint.