Integrate CtrlB Data Lake with Grafana
This document explains how to set up Grafana using a pre-built plugin folder, run it with Docker, and configure the CtrlB Lake Data Source.
Overview
The CtrlB Lake Data Source plugin enables seamless integration between Grafana and CtrlB's enterprise data platform, providing real-time analytics and visualization capabilities for your organization's data infrastructure.
Key Features
- Real-time data streaming from CtrlB Lake platform
- SQL-based querying with advanced analytics support
- Enterprise-grade security with custom authentication headers
- Scalable visualization supporting multiple concurrent users
- Docker-based deployment for consistent environments
System Requirements
Prerequisites
Before beginning the installation, ensure you have:
- CtrlB Lake plugin distribution package (
ctrlb-grafana-pluginfolder) - Valid CtrlB Lake credentials (endpoint URL and authorization token)
- Network connectivity to CtrlB services
Installation and Configuration
Step 1: Environment Setup
-
Create a dedicated project directory:
mkdir ctrlb-grafana-integration
cd ctrlb-grafana-integration -
Download and Extract the Plugin Distribution:
You can download the latest CtrlB Grafana Plugin package directly using the link below:
Once downloaded, extract it into your project directory:
unzip ctrlb-grafana-plugin.zip -d ./ctrlb-grafana-pluginVerify that the extracted folder contains the plugin files:
ls -la ctrlb-grafana-plugin/
Step 2: Deploy Grafana Container
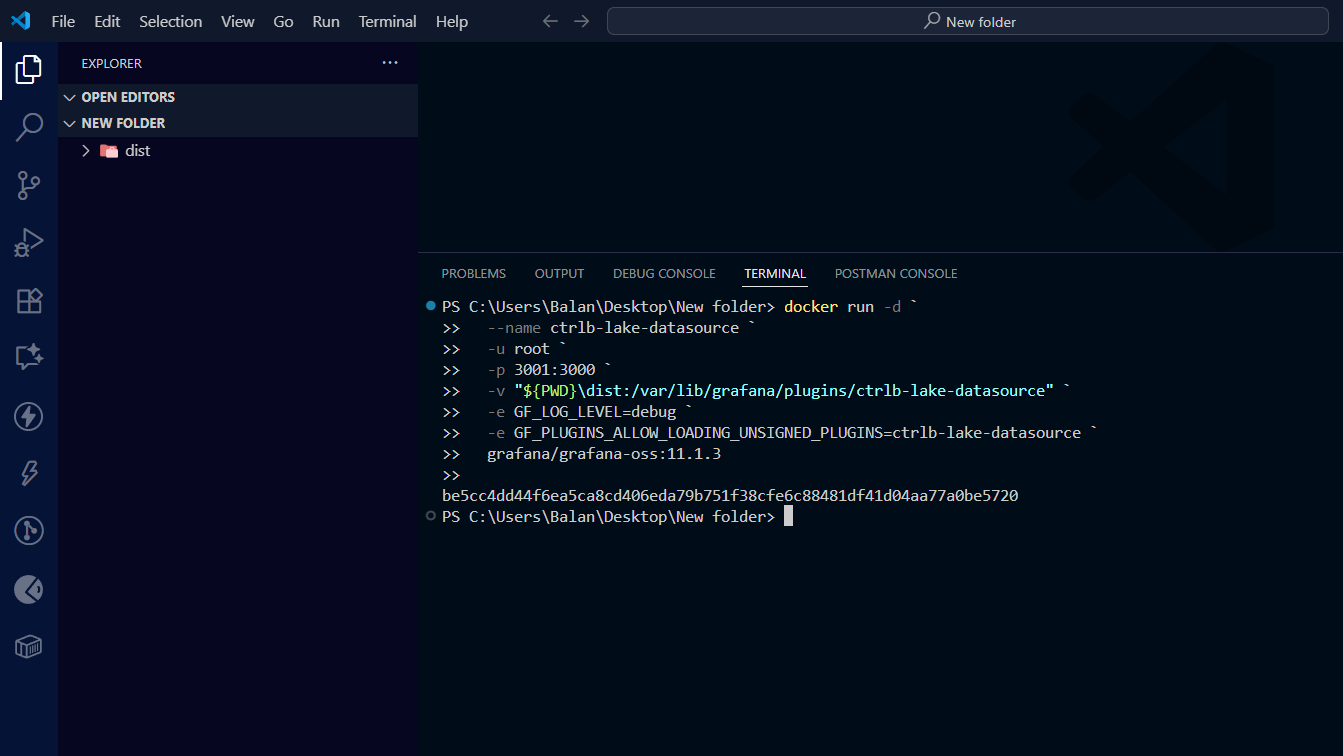
Execute the following command to deploy Grafana with the CtrlB Lake plugin:
docker run -d \
  --name ctrlb-lake-grafana \
  --restart unless-stopped \
  -u root \
  -p 3000:3000 \
  -v "$(pwd)/ctrlb-grafana-plugin:/var/lib/grafana/plugins/ctrlb-lake-datasource" \
  -e GF_LOG_LEVEL=info \
  -e GF_PLUGINS_ALLOW_LOADING_UNSIGNED_PLUGINS=ctrlb-lake-datasource \
  -e GF_INSTALL_PLUGINS="" \
  grafana/grafana-oss:11.1.3
Step 3: Verify Installation
-
Check container status:
docker ps | grep ctrlb-lake-grafana -
Verify plugin loading:
docker logs ctrlb-lake-grafana | grep "ctrlb-lake-datasource" -
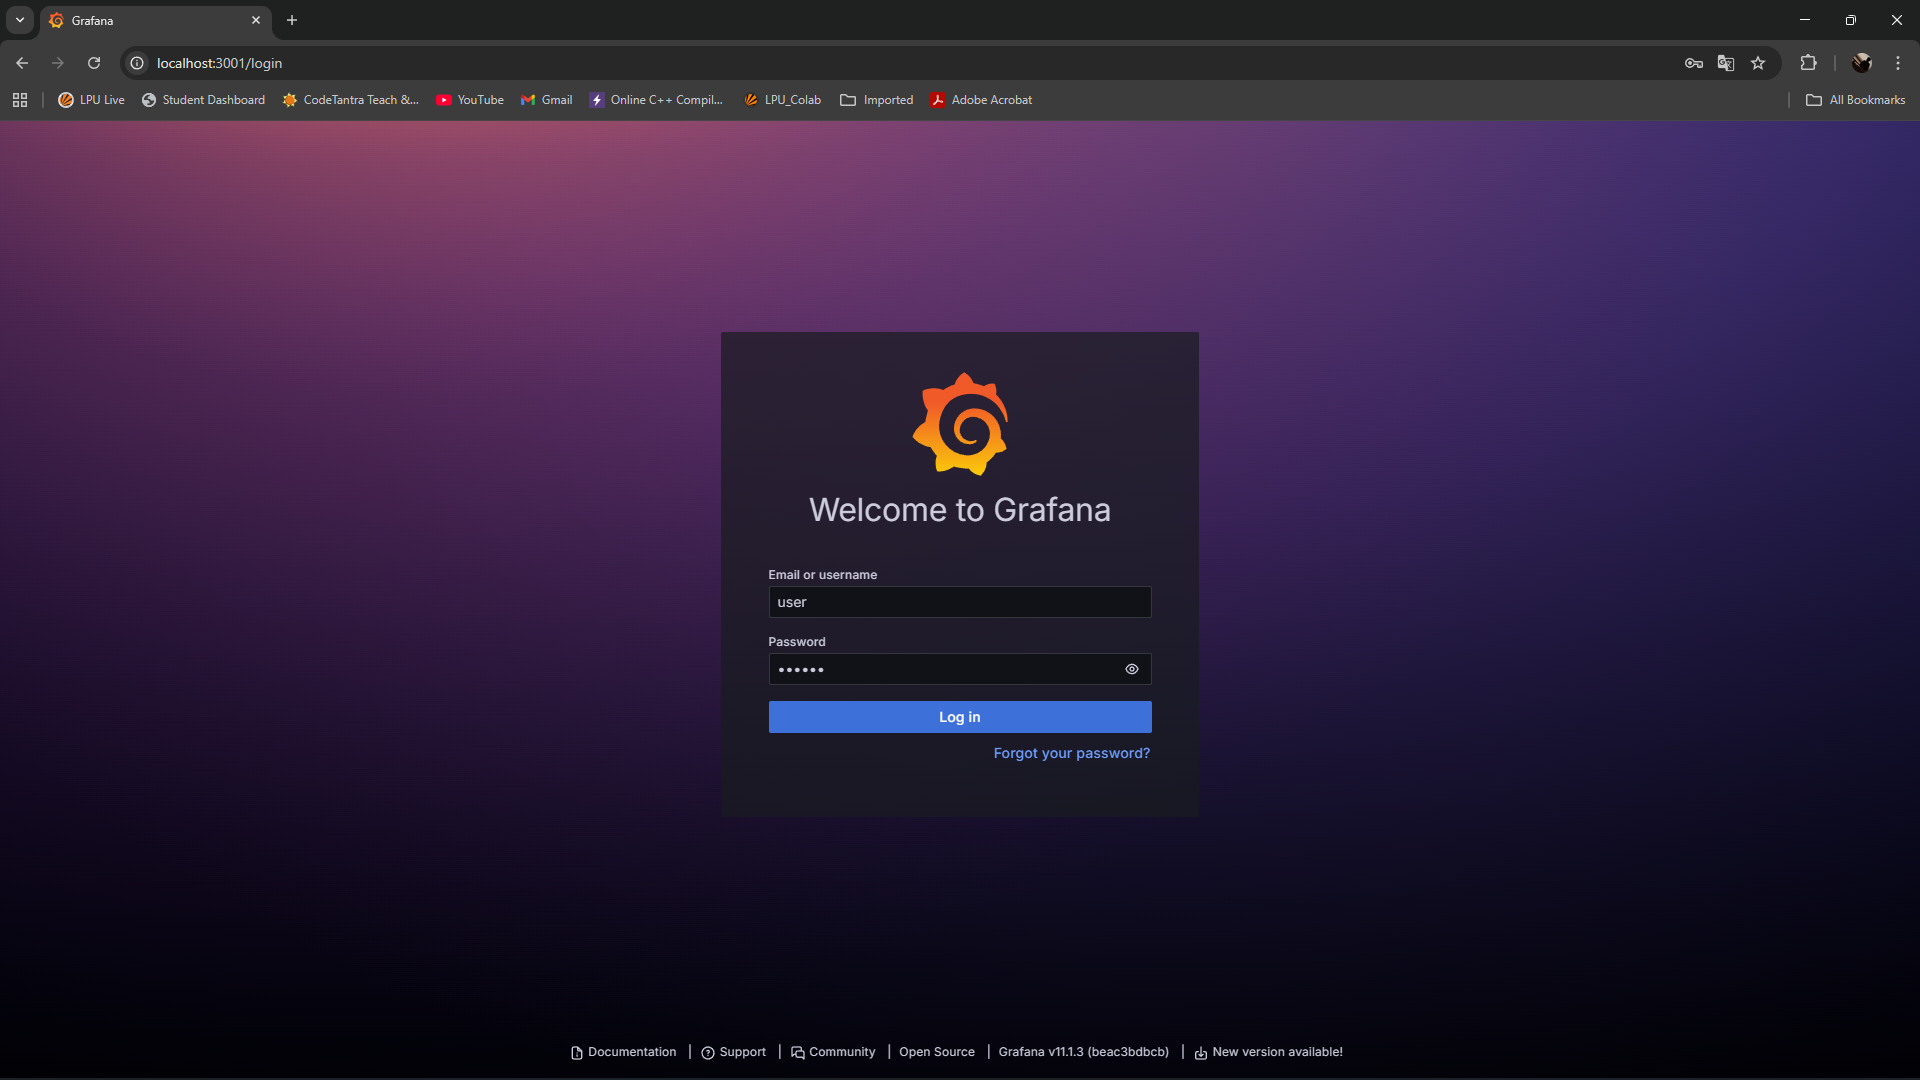
Access Grafana interface:
- Navigate to:
http://localhost:3000 - Default credentials:
admin/admin - Change the default password when prompted
- Navigate to:
Data Source Configuration
Step 1: Access Data Source Management
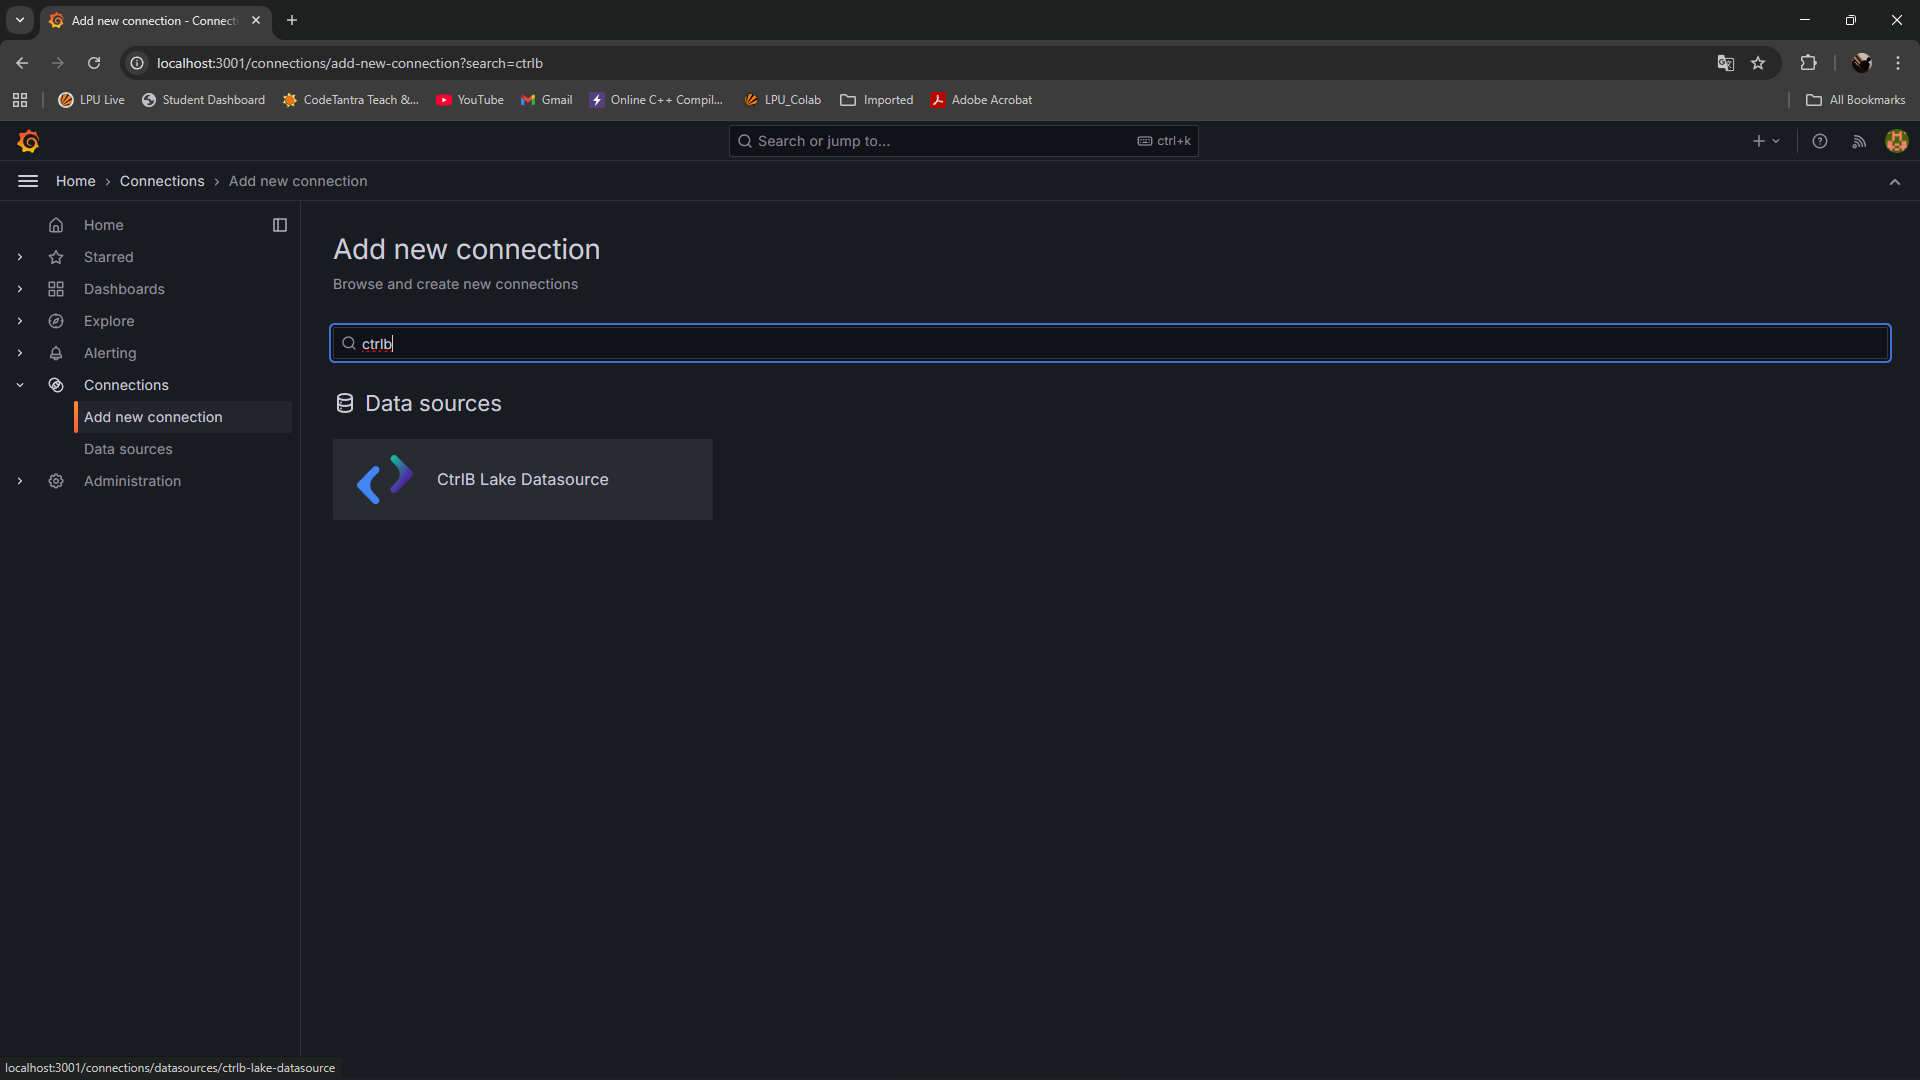
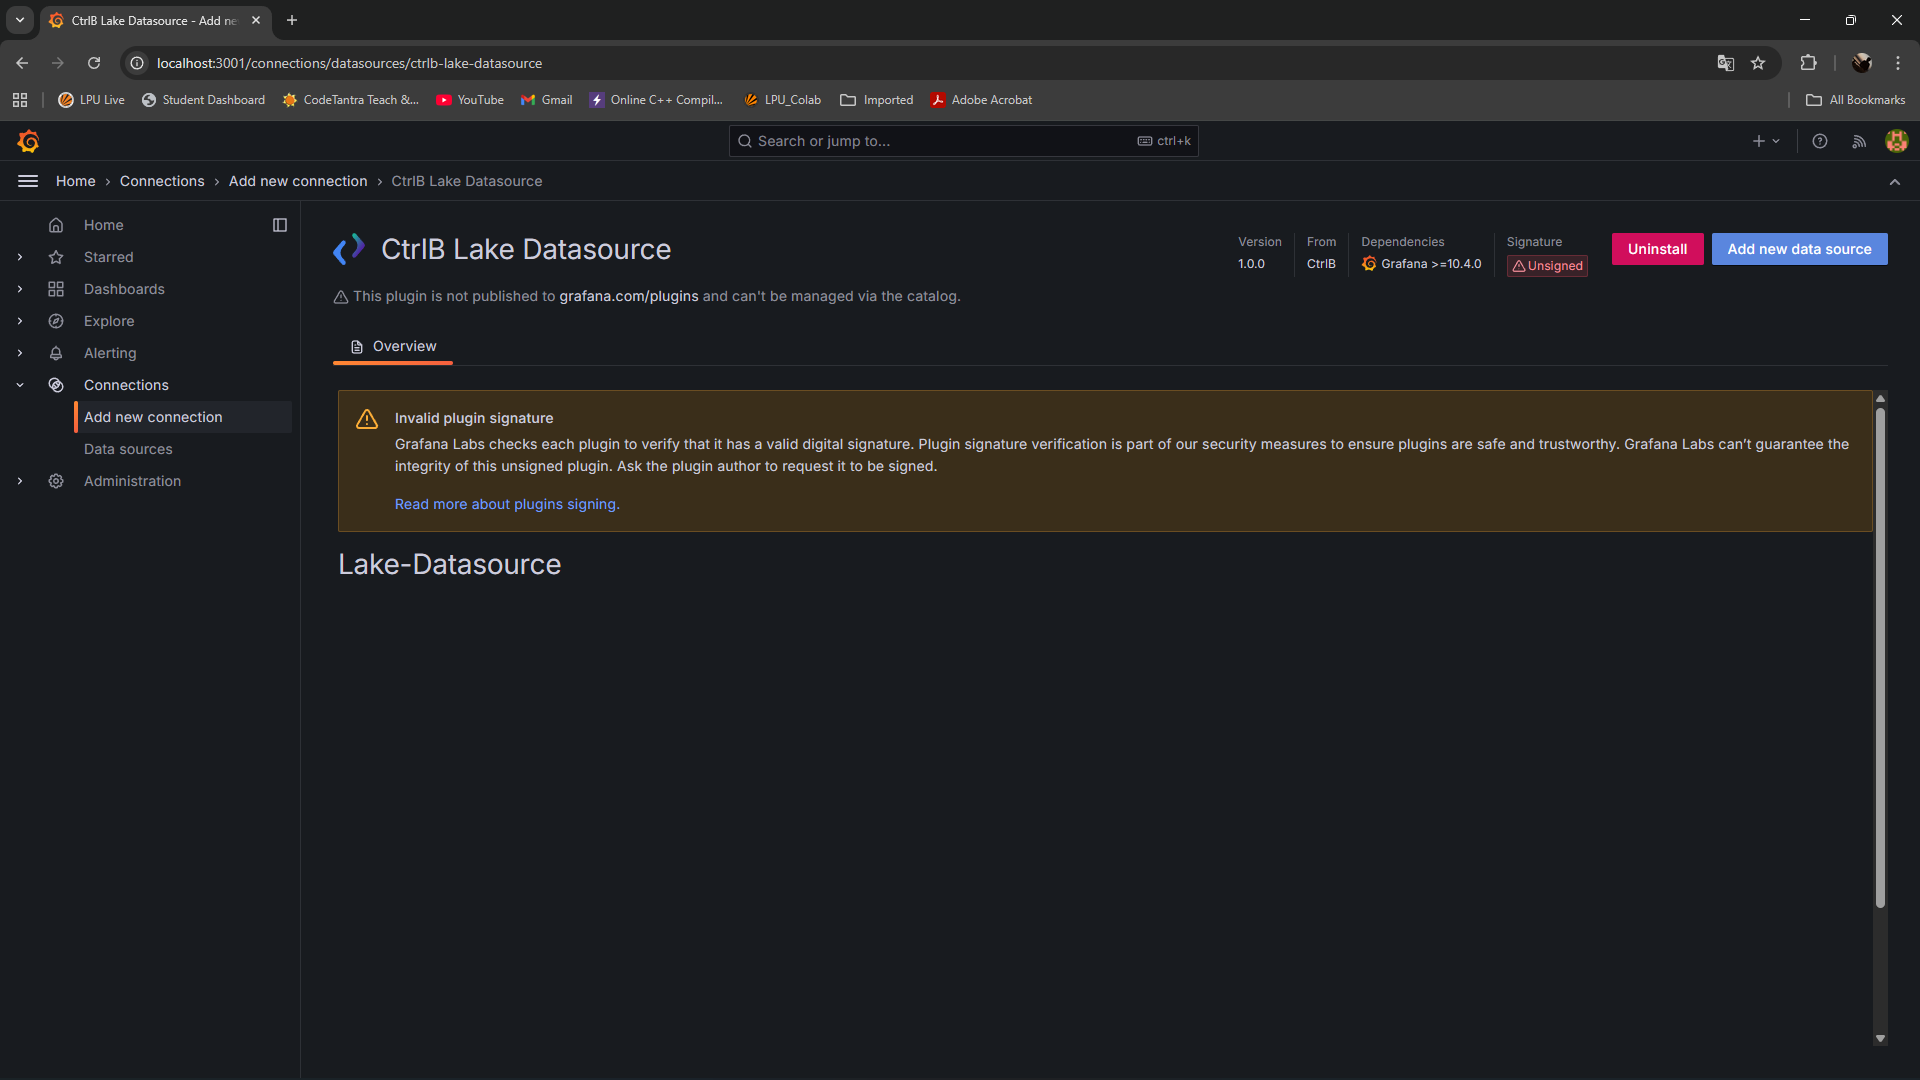
- In the Grafana interface, navigate to Connections > Add new data source
- Search for and select CtrlB Lake Data Source
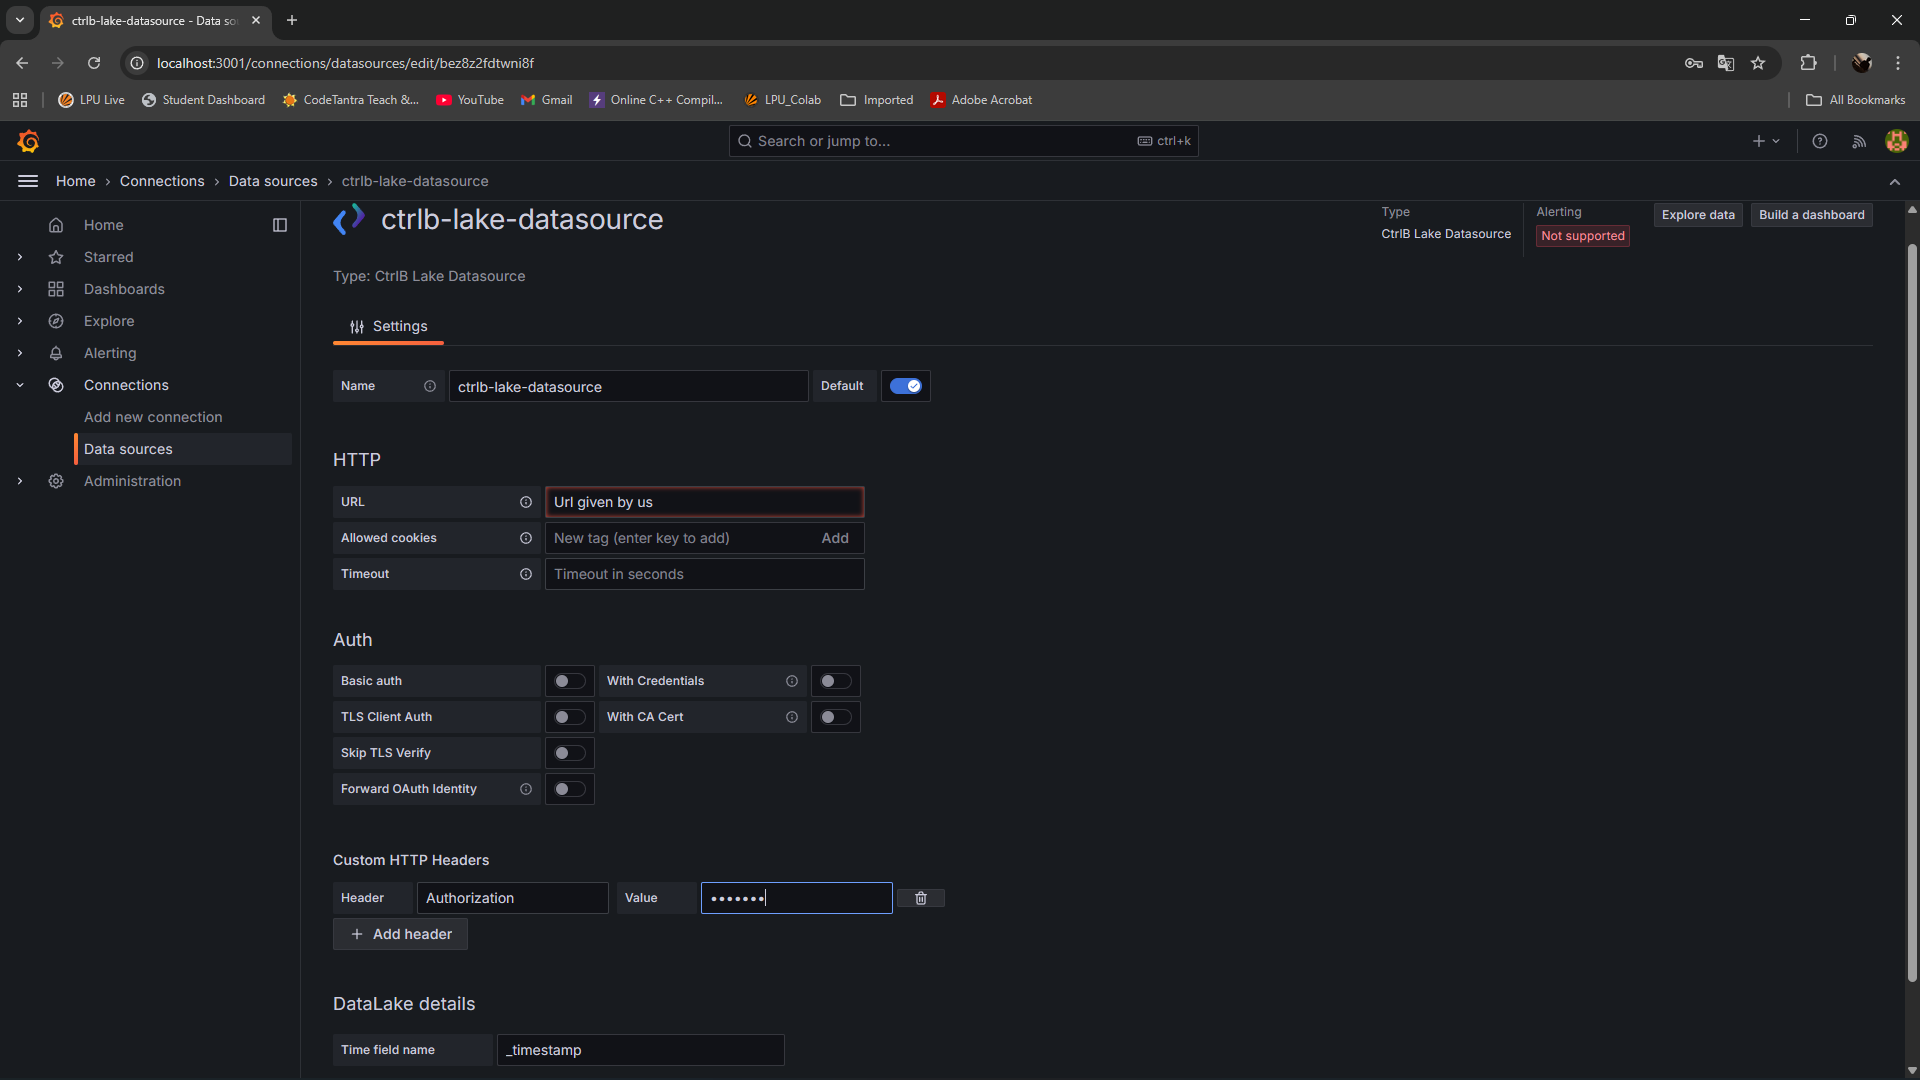
Step 2: Configure Connection Parameters
Configure the following settings:
| Parameter | Description | Example |
|---|---|---|
| Name | Descriptive name for the data source | CtrlB Lake Production |
| URL | CtrlB Lake endpoint URL | https://api.ctrlb.com/lake/v1 |
| Authentication | Custom header configuration | See below |
Step 3: Authentication Setup
Configure the custom authentication header:
- Header Name:
Authorization - Header Value:
Basic [YOUR_API_TOKEN]
Security Note: Store API tokens securely and rotate them according to your organization's security policies.
Step 4: Connection Validation
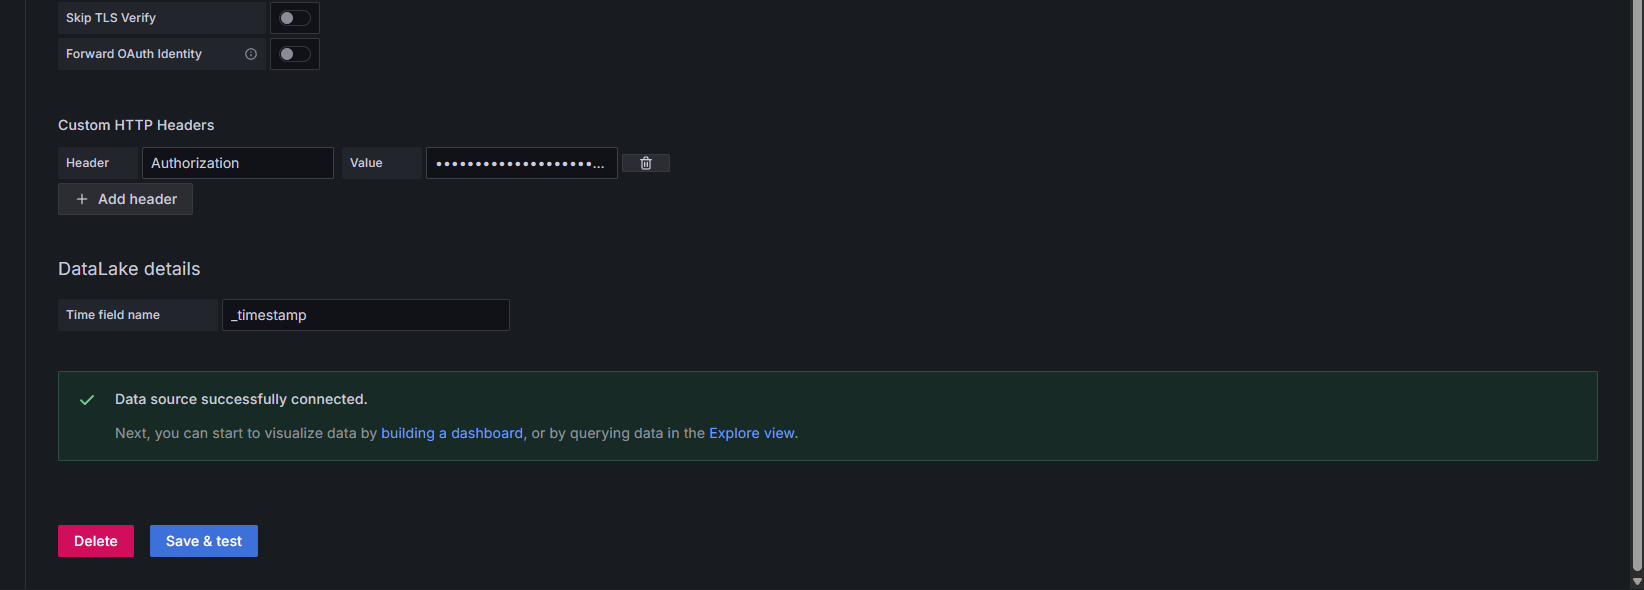
- Click Save & test to validate the configuration
- Verify the success message: "Data source is working"
- If connection fails, review the troubleshooting section below
Dashboard Development
Method 1: Using Explore (Recommended for Initial Setup)
-
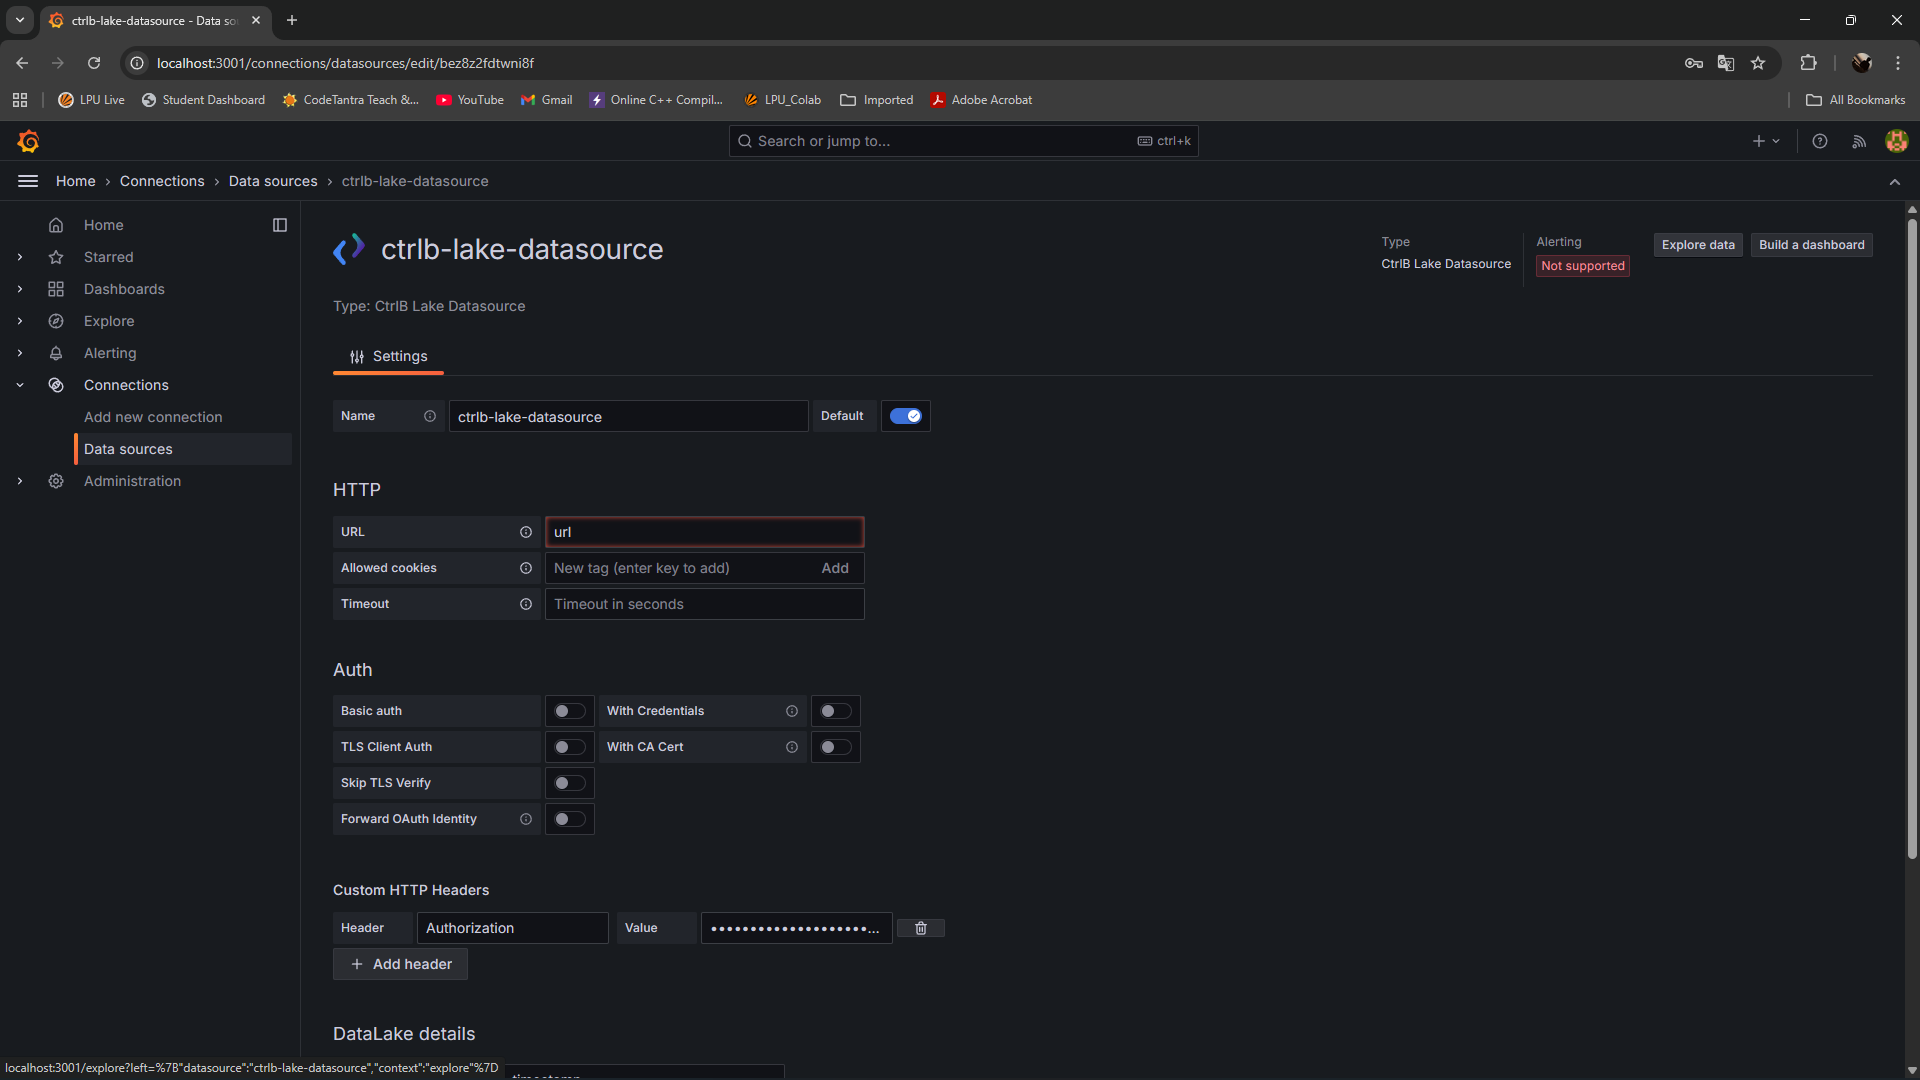
From the data source configuration page, click Explore
-
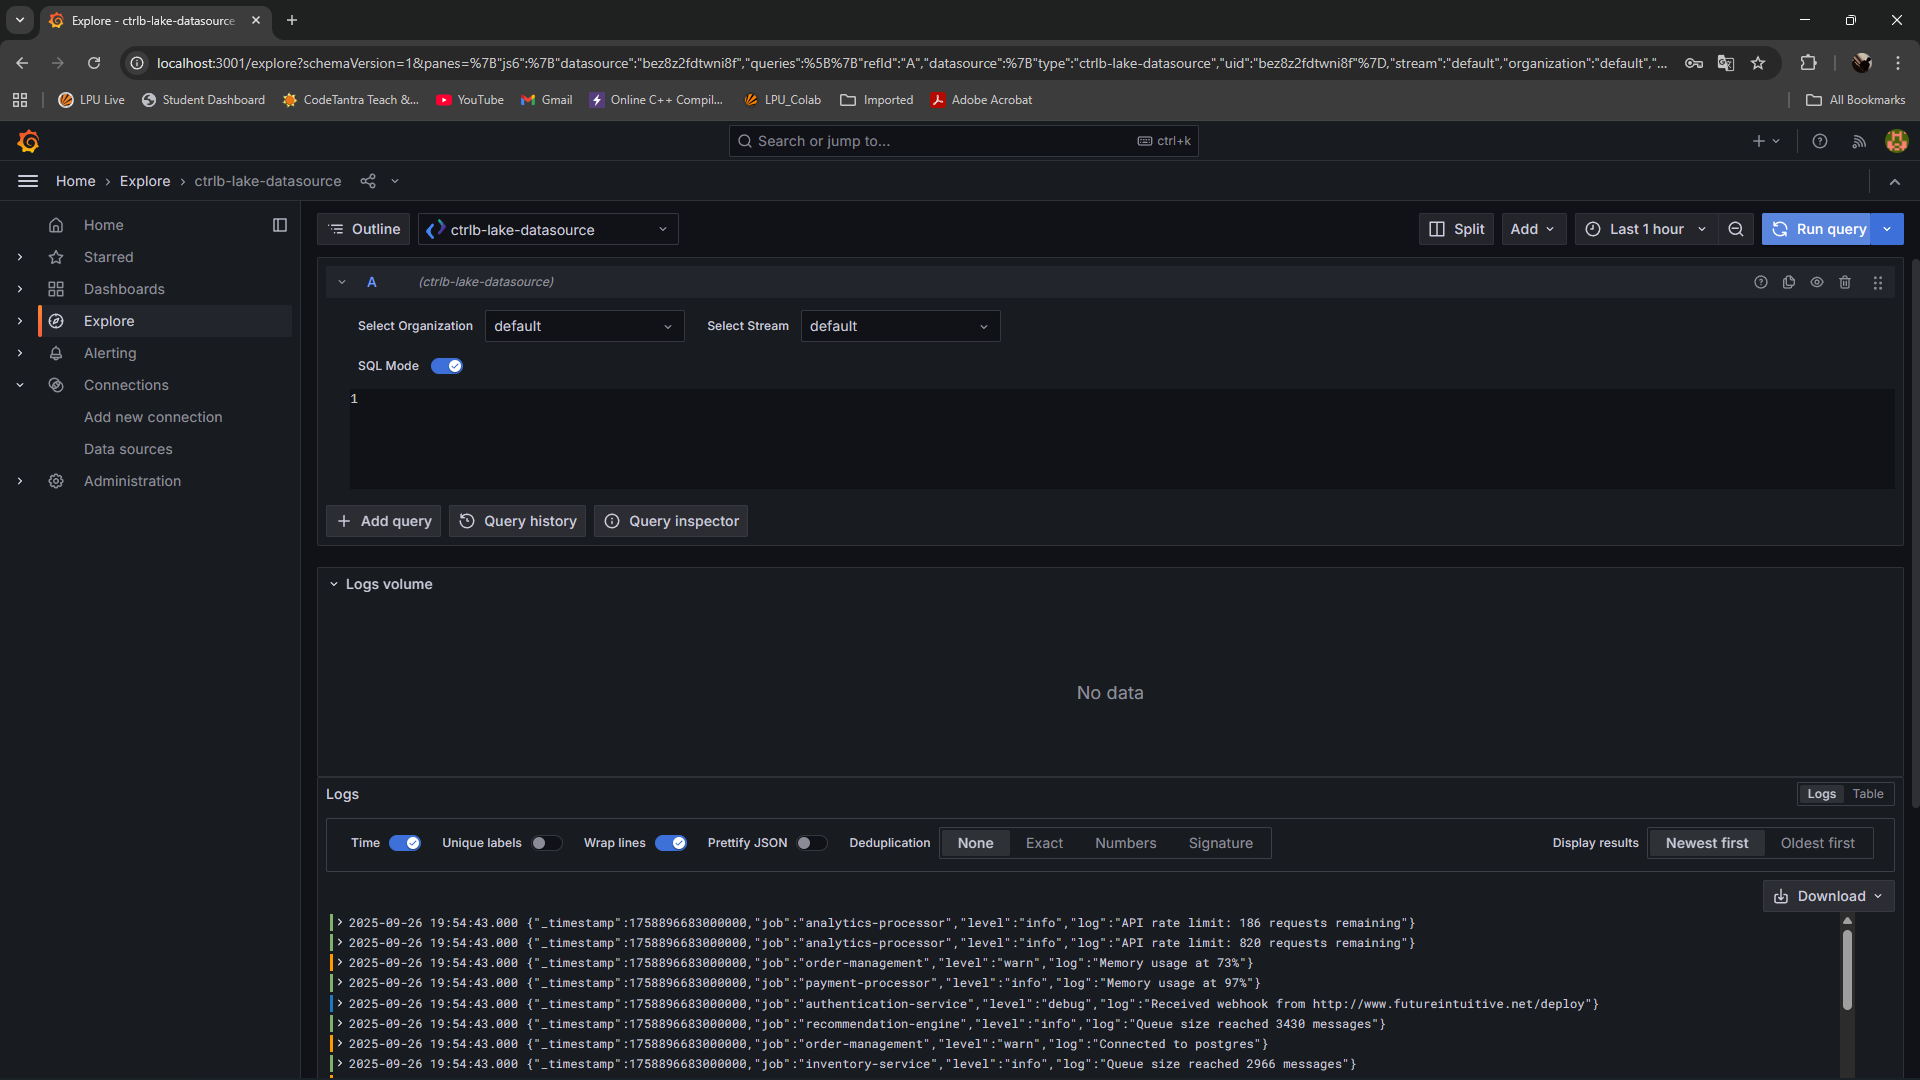
Select your target stream from the dropdown
-
Enable SQL query mode
-
Enter your query in the editor:
SELECT *
FROM <STREAM_NAME>
WHERE timestamp >= NOW() - INTERVAL '1 hour'
ORDER BY timestamp DESC
LIMIT 1000 -
Click Run query to execute and preview results
Method 2: Dashboard Creation
-
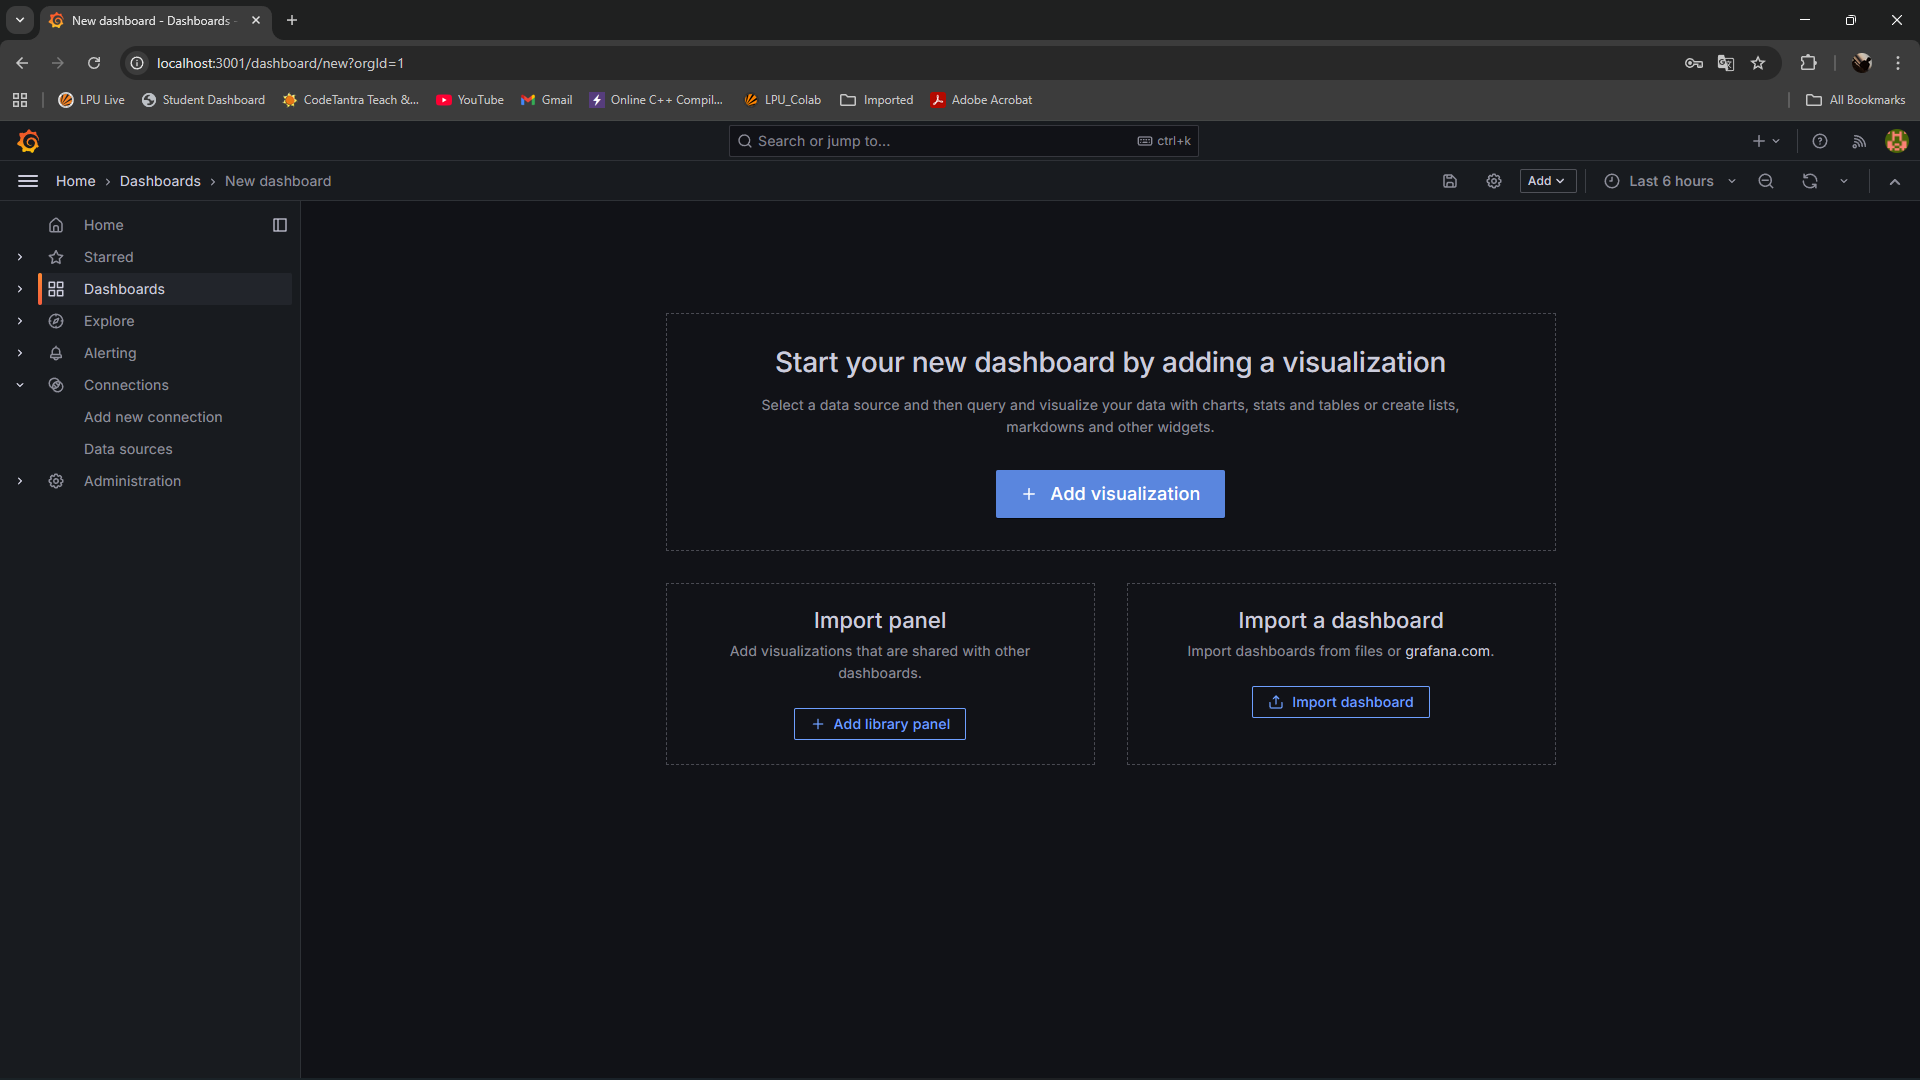
Navigate to Dashboards → New → New Dashboard
-
Click Add visualization
-
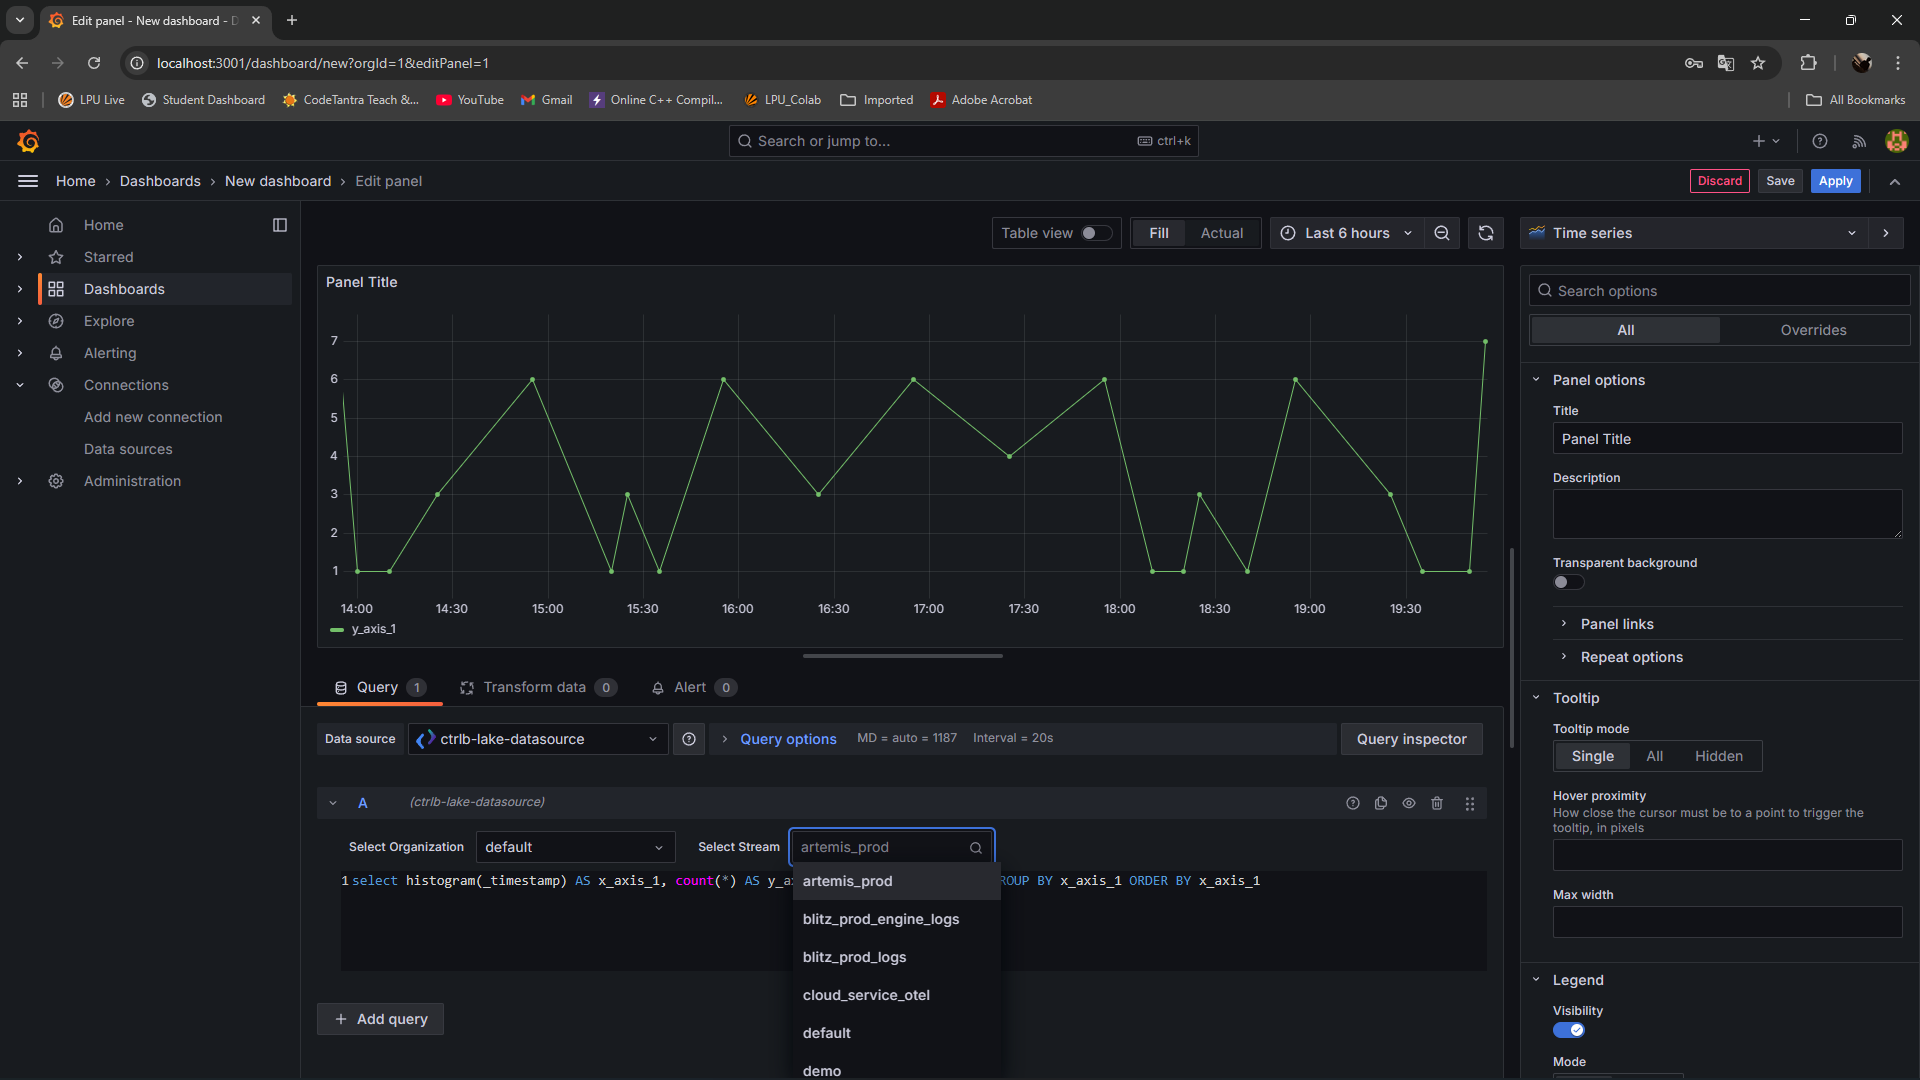
Configure the panel:
- Data source: Select your CtrlB Lake data source
- Stream: Choose the appropriate data stream
- Query: Write your SQL query
- Visualization: Select chart type (Time series, Table, etc.)
- Configure panel options:
- Title: Descriptive panel name
- Description: Context and purpose
- Refresh rate: Set appropriate interval
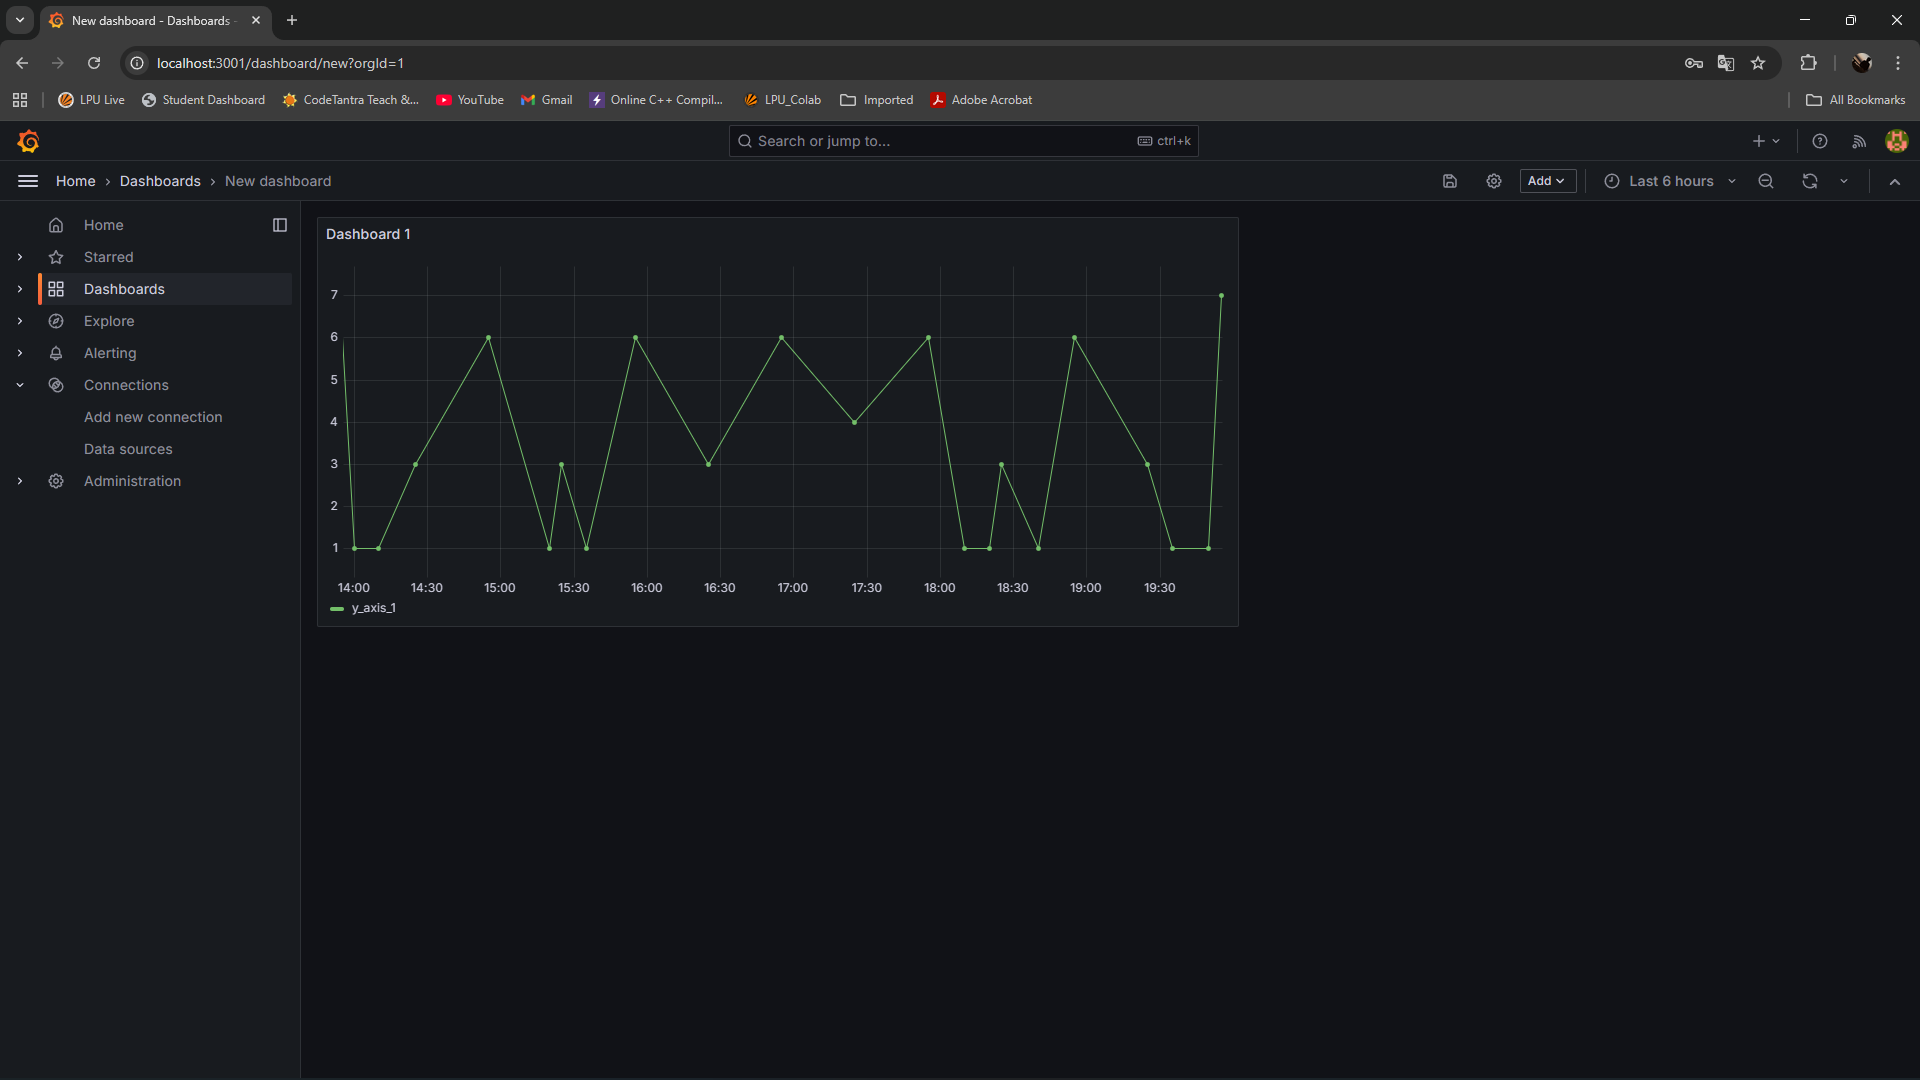
- Click Apply to save the panel
Performance Optimization
Query Optimization Best Practices
- Use appropriate time ranges to limit data volume
- Limit result sets using
LIMITclauses - Leverage aggregation functions for summary views
- Use dashboard variables to reduce query complexity
Troubleshooting
Common Issues and Resolutions
Plugin Loading Failures
Symptoms: Plugin not appearing in data sources list
Resolution:
- Verify the
GF_PLUGINS_ALLOW_LOADING_UNSIGNED_PLUGINSenvironment variable - Check plugin folder permissions:
docker exec ctrlb-lake-grafana ls -la /var/lib/grafana/plugins/ - Review container logs for plugin-related errors
Connection Authentication Errors
Symptoms: "Unauthorized" or "Forbidden" responses
Resolution:
- Verify API token validity and permissions
- Check authorization header format
- Confirm network connectivity to CtrlB endpoints
- Review firewall and proxy configurations
Diagnostic Commands
# Container resource usage
docker stats ctrlb-lake-grafana

# Detailed logs with timestamps
docker logs --timestamps ctrlb-lake-grafana

# Plugin directory contents
docker exec ctrlb-lake-grafana find /var/lib/grafana/plugins/ -type f

# Network connectivity test
docker exec ctrlb-lake-grafana wget --spider https://your-ctrlb-endpoint.com

# Database integrity check
docker exec ctrlb-lake-grafana sqlite3 /var/lib/grafana/grafana.db "PRAGMA integrity_check;"