Metabase Setup & Connection Guide
This guide explains how to run Metabase using Docker Compose, connect it to the CtrlB Postgres database, execute SQL queries, and create dashboards with charts.
1. Running Metabase Using Docker Compose
Create a directory for Metabase (optional):
mkdir metabase && cd metabase
Create a docker-compose.yaml file:
services:
  metabase:
    image: metabase/metabase
    container_name: metabase
    ports:
      - 3000:3000
    volumes:
      - /var/lib/metabase:/metabase-data
    environment:
      - MB_DB_FILE=/metabase-data/metabase.db
    restart: unless-stopped
Start Metabase:
docker compose up -d
Check that Metabase is running:
docker ps
Open Metabase in your browser:
http://localhost:3000
On first launch, Metabase will prompt you to create an admin account.
2. Connecting Metabase to the CtrlB Database
You can add the CtrlB Postgres database connection either during the initial setup wizard or later from:
Settings → Admin → Databases → Add database
Enter the Database Credentials:
| Field | Value |
|---|---|
| Name | |
| Database Type | PostgreSQL |
| Host | <INSTANCE URL/IP> provided or host.docker.internal (if the engine is running on the same host) |
| Port | 5432 |
| Database Name | default |
| Username | postgres |
| Password | <Credential provided> |
Click Save to test and store the connection.
3. Running a SQL Query in Metabase
To run SQL queries:
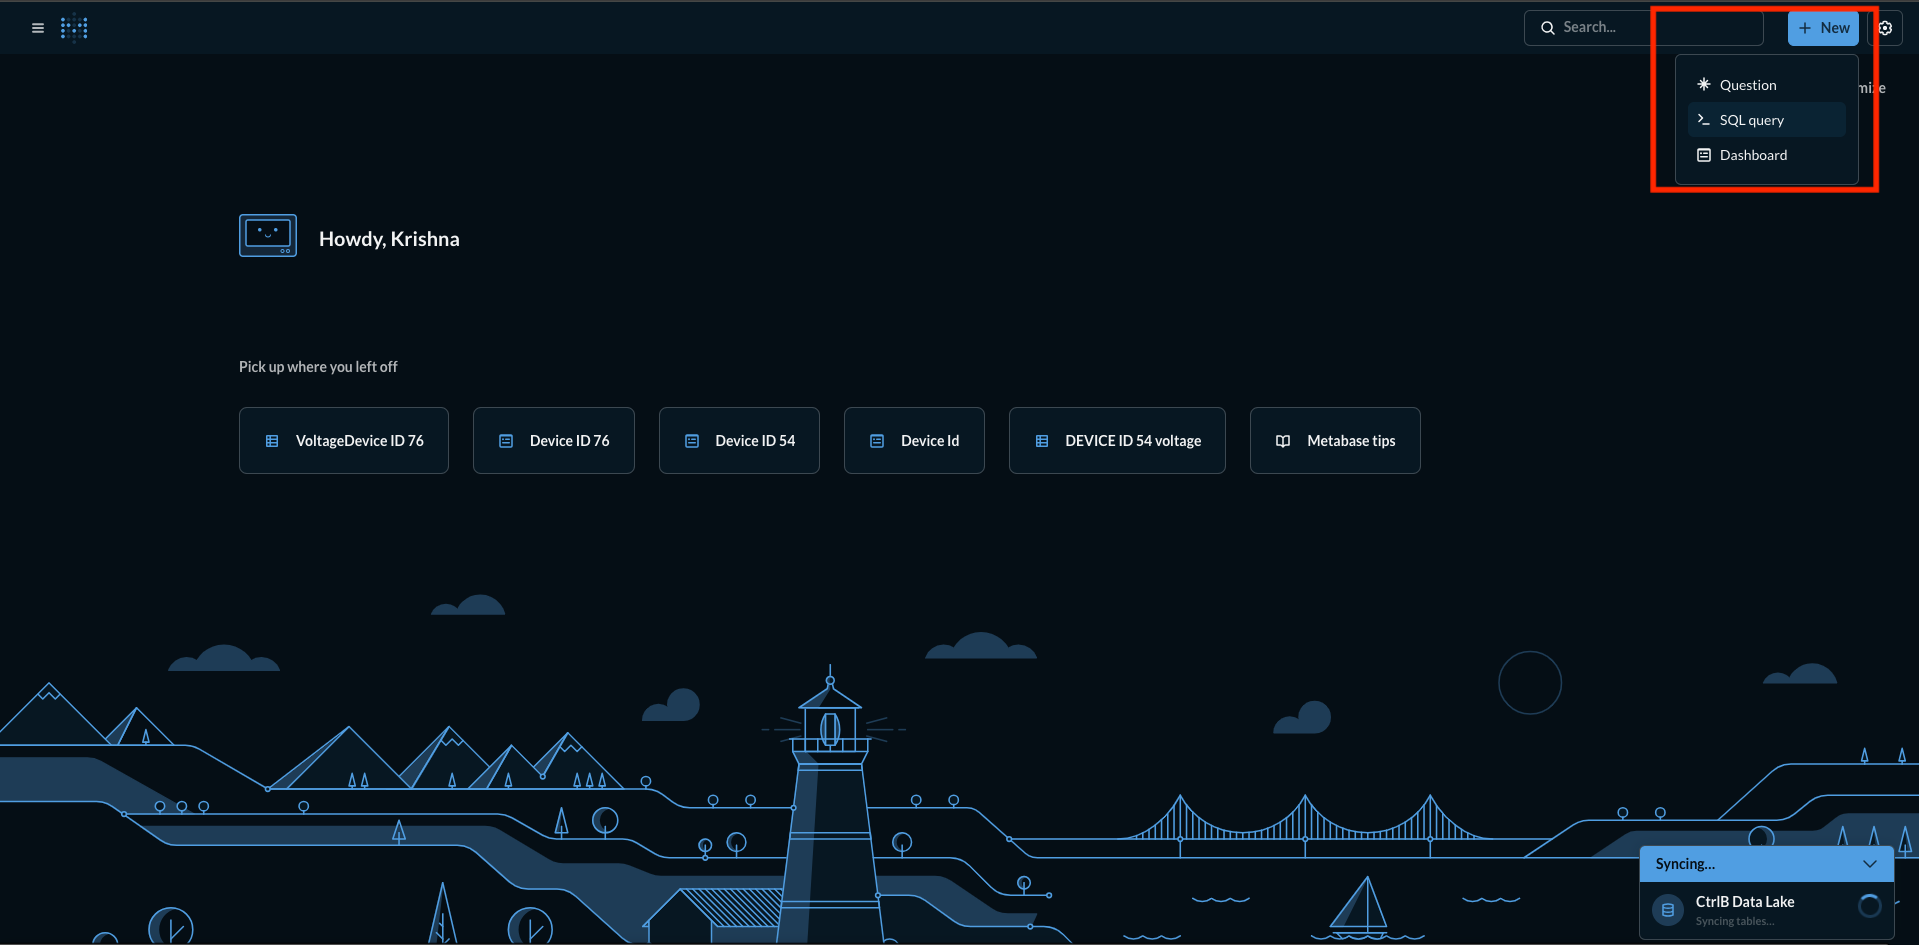
Click New → Select SQL query → And Select your database
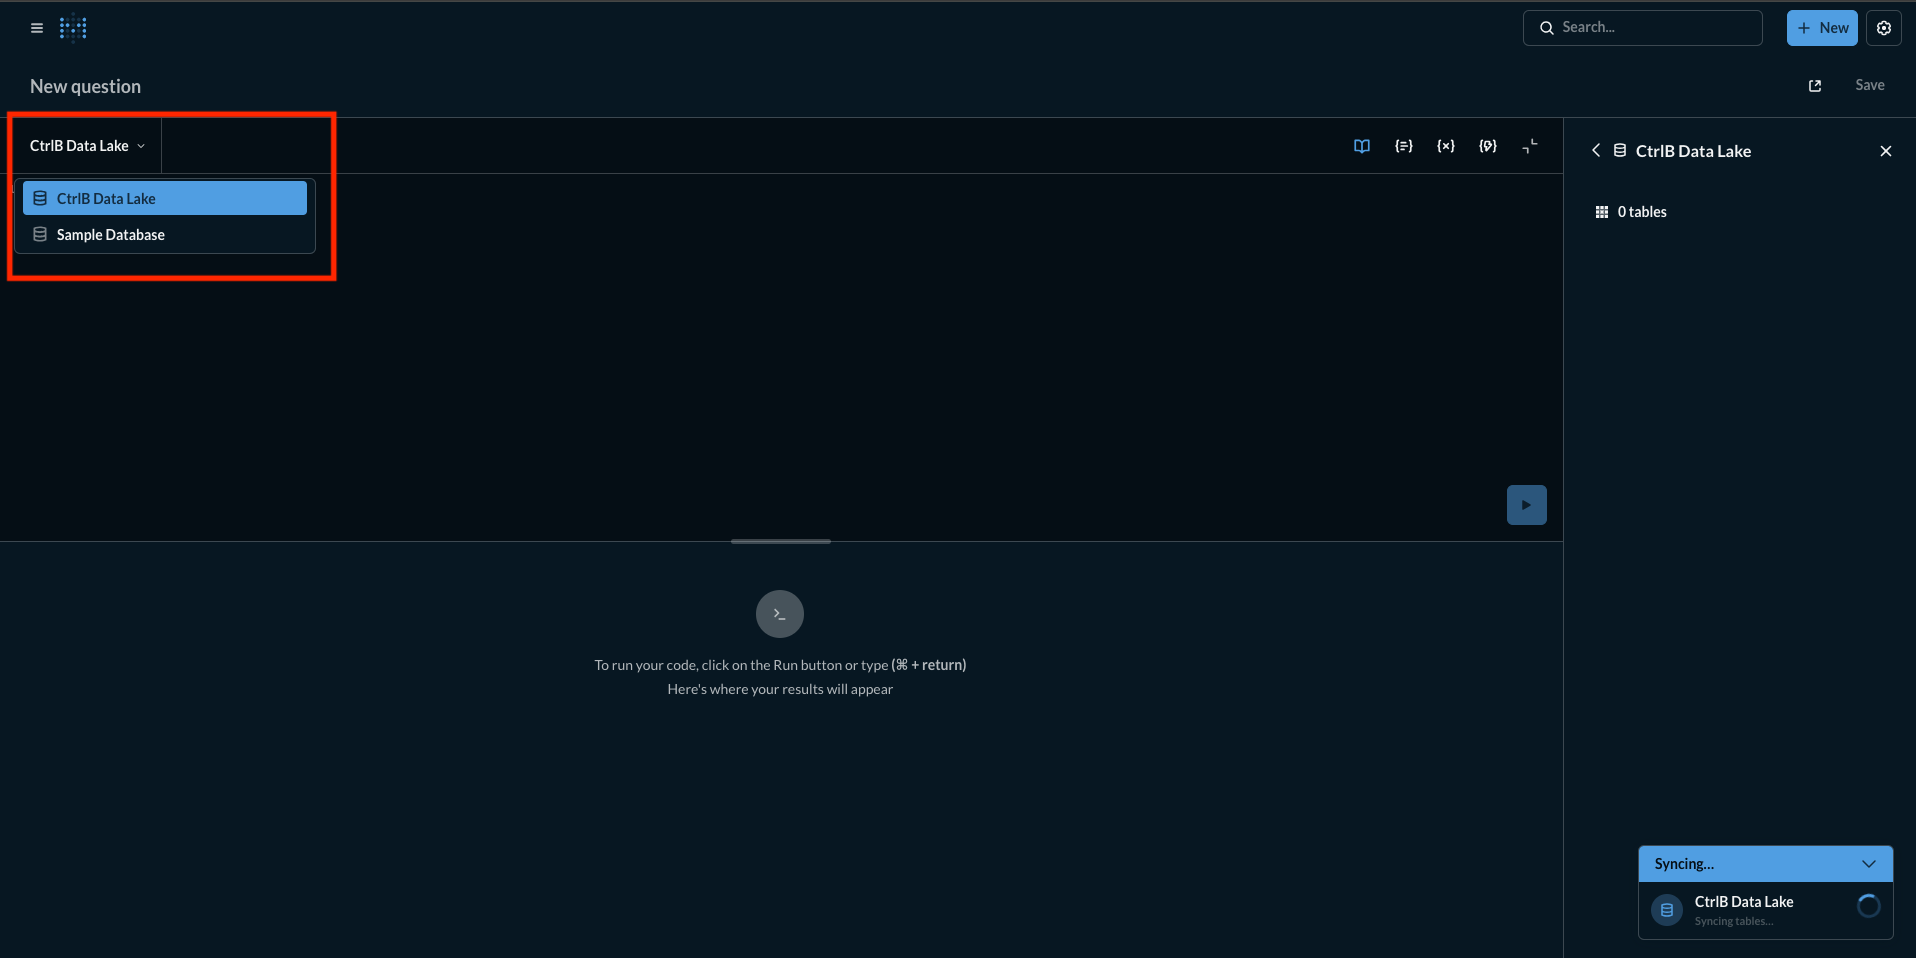
Write your SQL Query and Click on Run
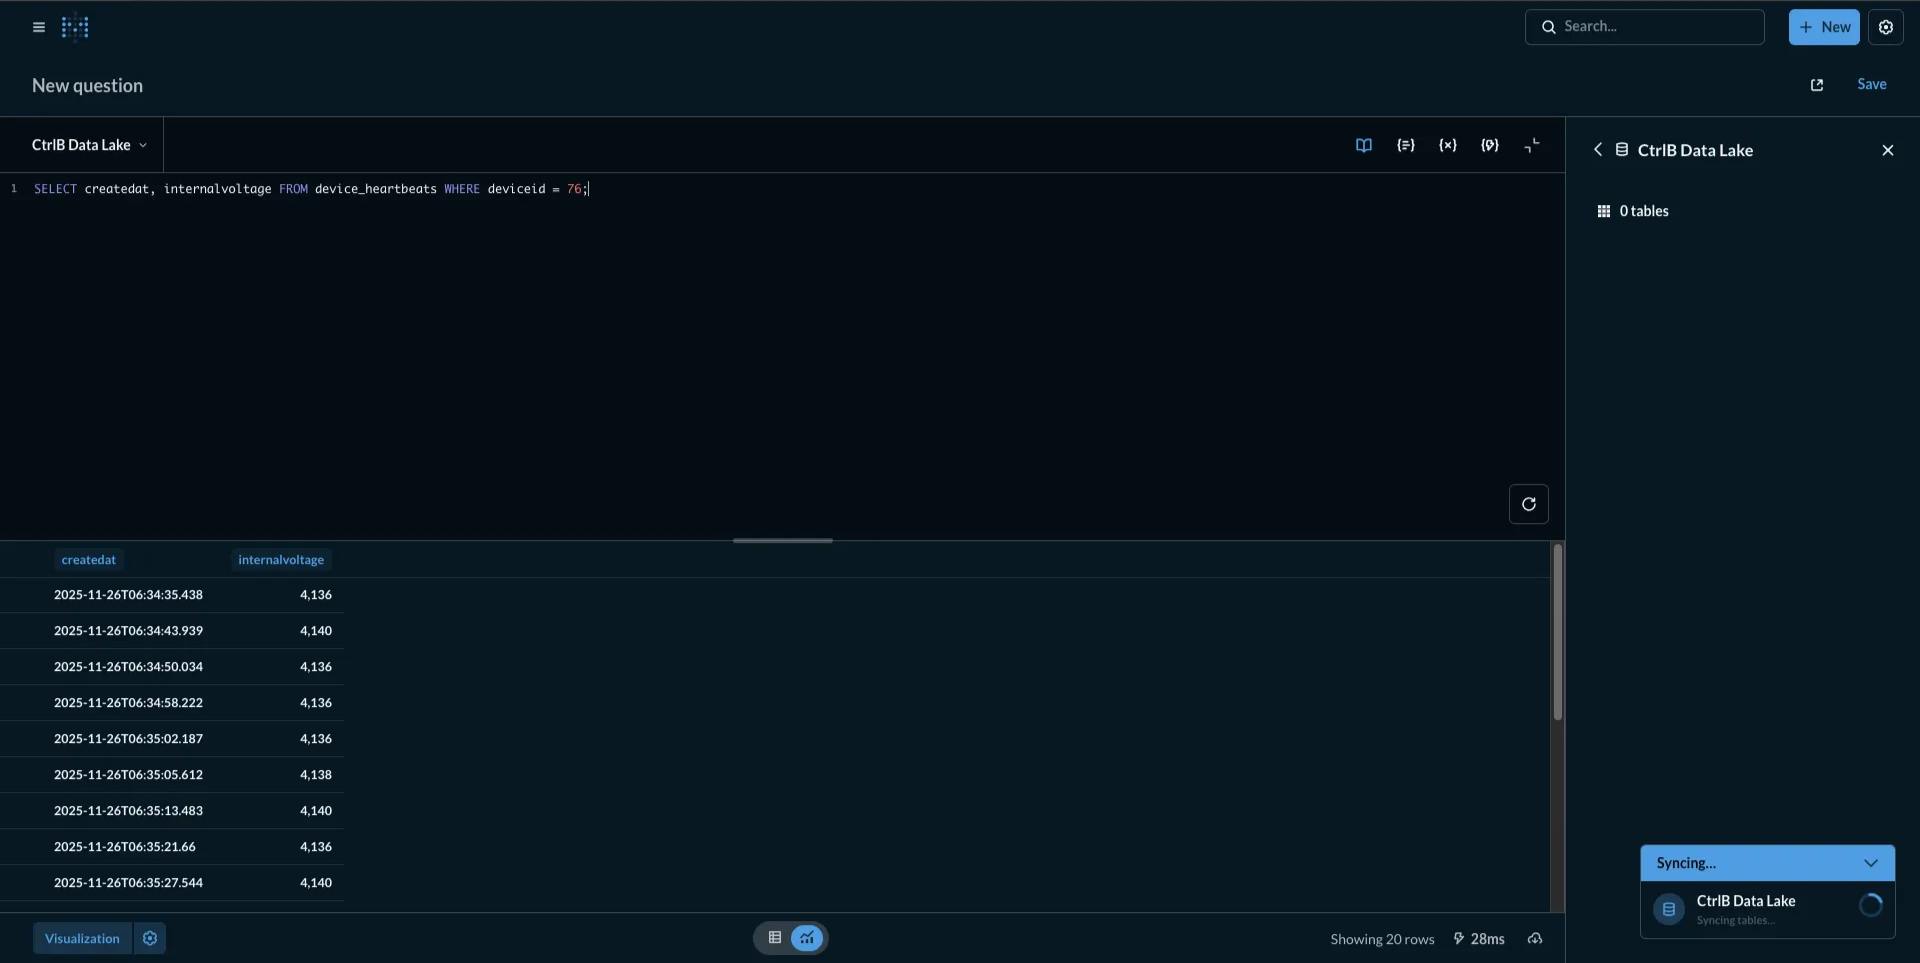
SELECT createdat, internalvoltage FROM device_heartbeats WHERE deviceid = 76;
Additional Filtering
SELECT *
FROM device_heartbeats
WHERE deviceid = 73;
Filter by time:
SELECT *
FROM device_heartbeats
WHERE _timestamp >= 1690000000000000;
Here _timestamp is stored in Unix microseconds.
Visualisation
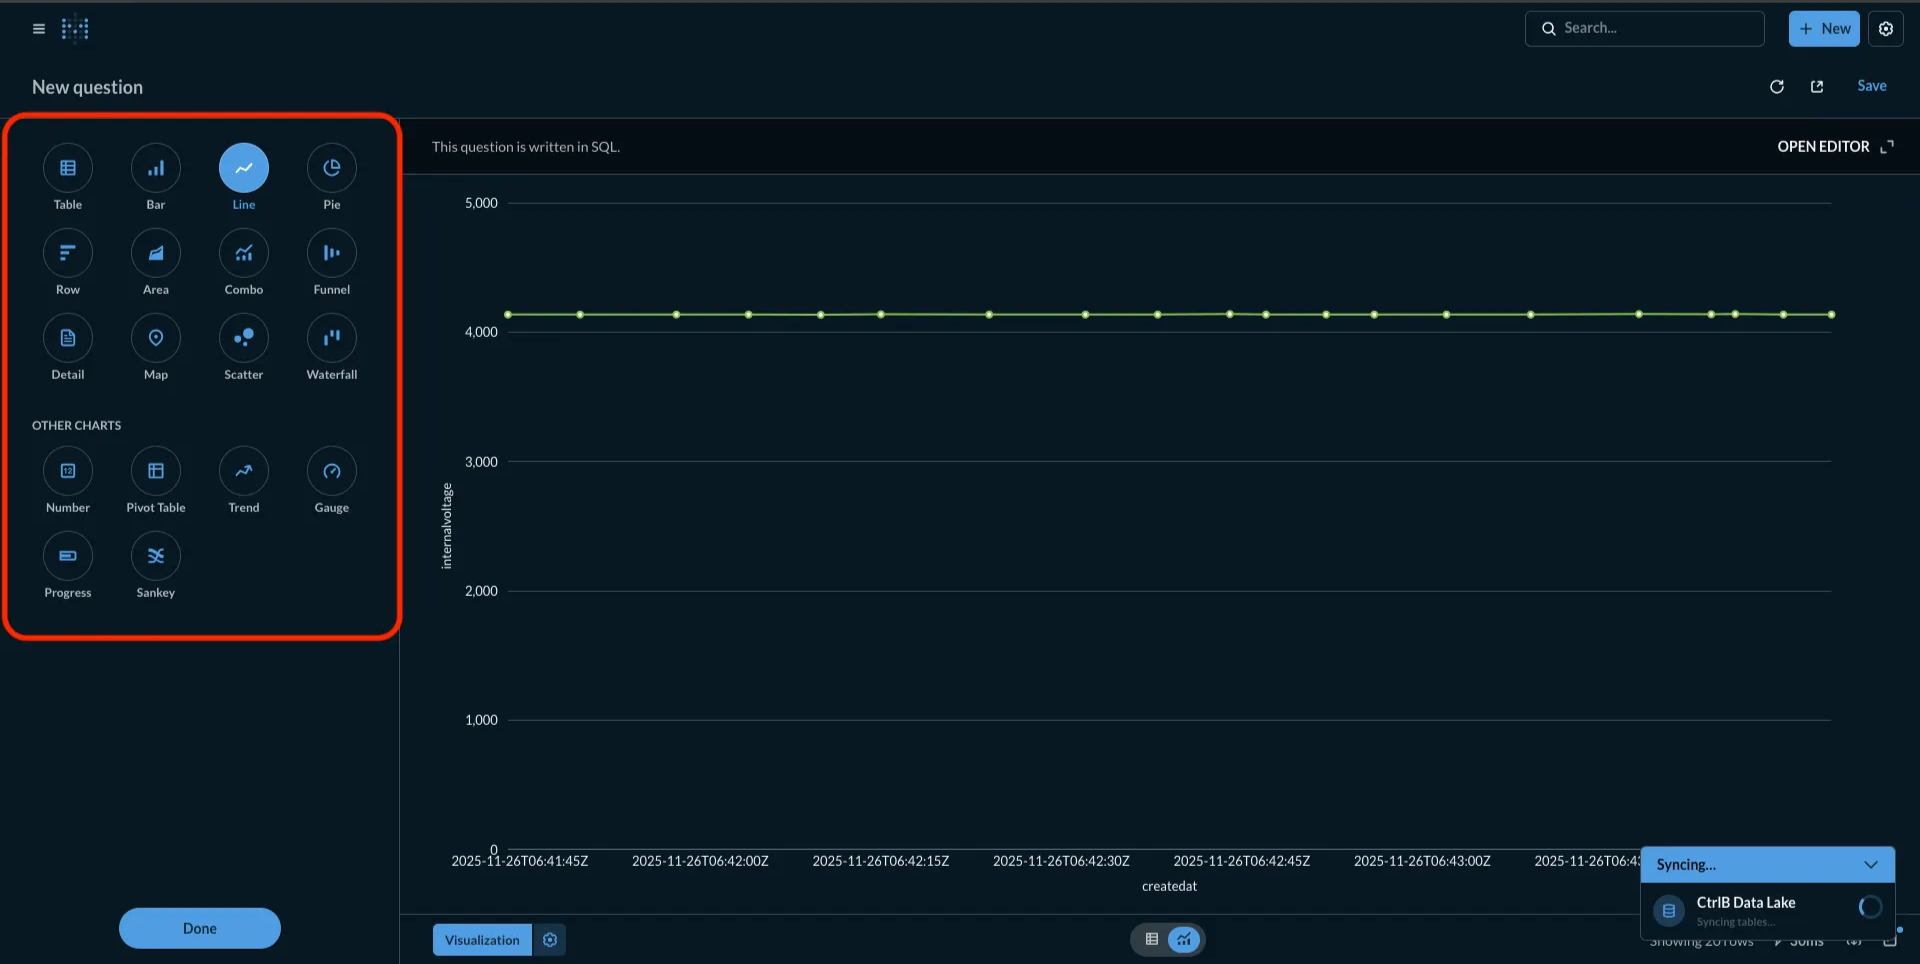
To see charts for the query Click on the visualisation button
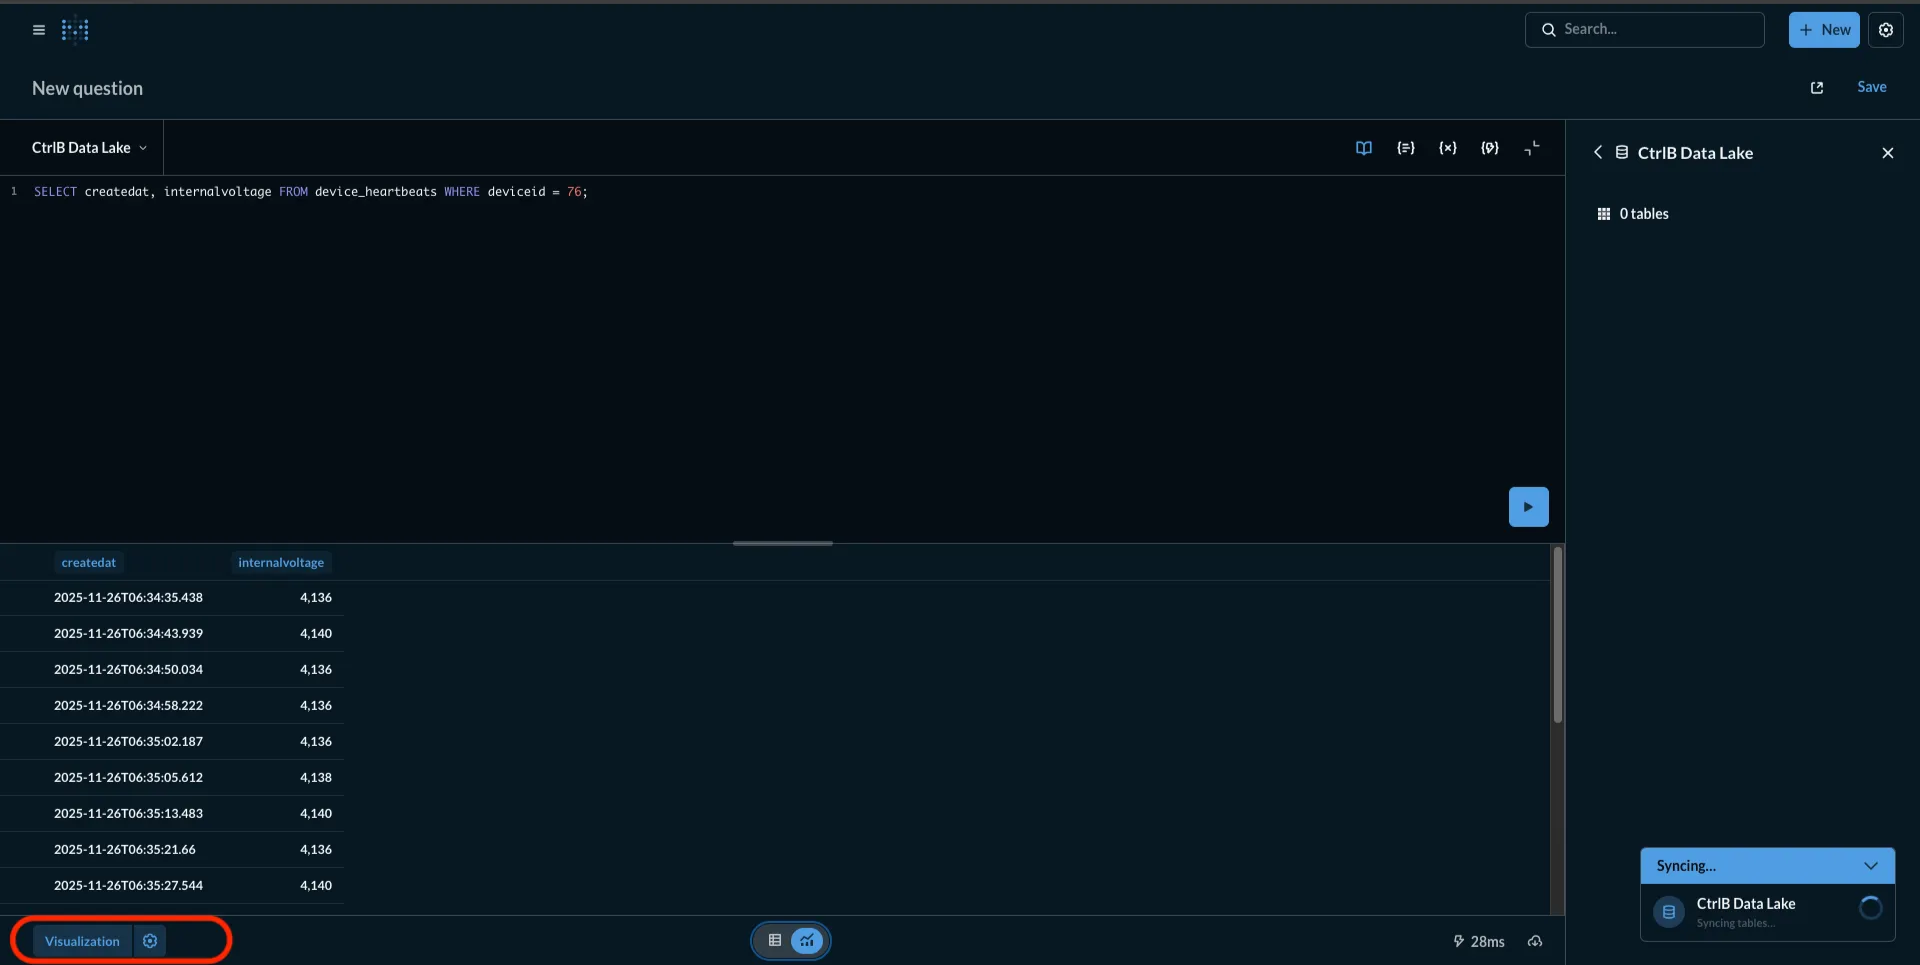
And Select your desired type of chart
4. Creating Dashboards & Charts
Metabase allows you to convert SQL query results into visual charts and add them to dashboards.
Creating a Dashboard
- Click New → Dashboard
- Give your dashboard a name and save it
- You can now add cards (visualisations) into it
Using Saved SQL Queries or Creating New Ones
Inside the dashboard:
-
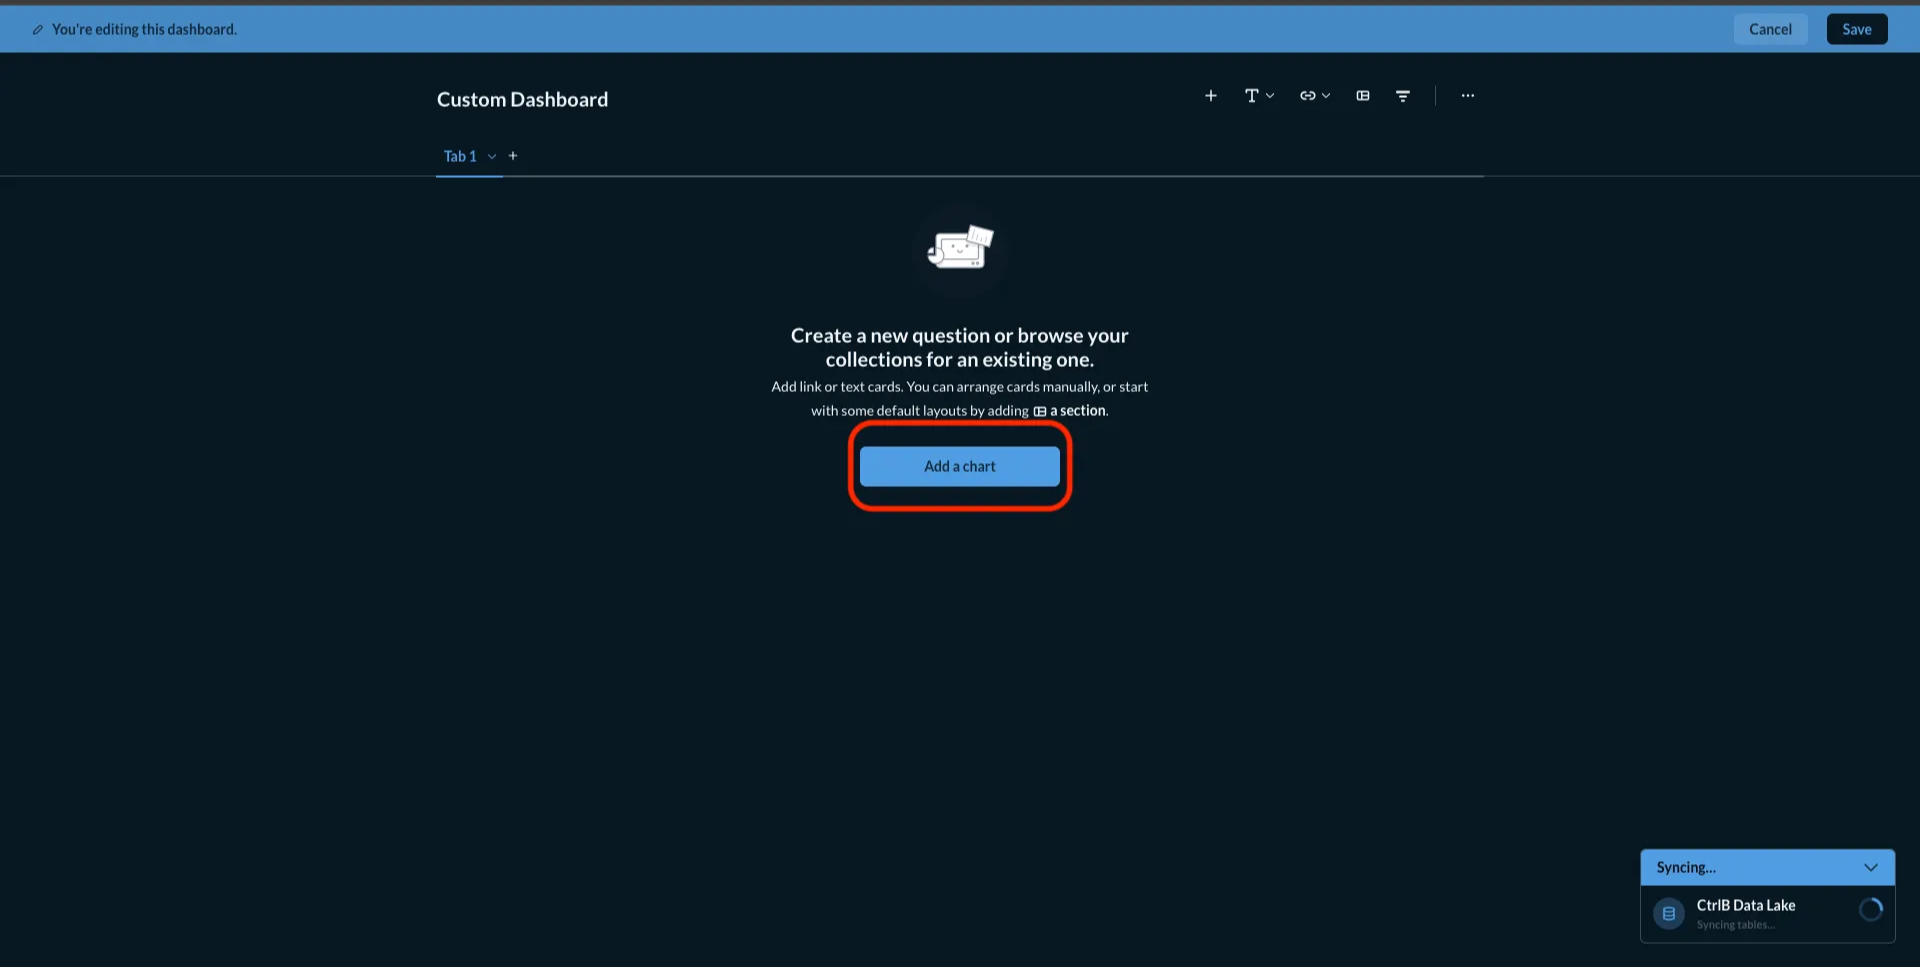
Click Add a Chart
-
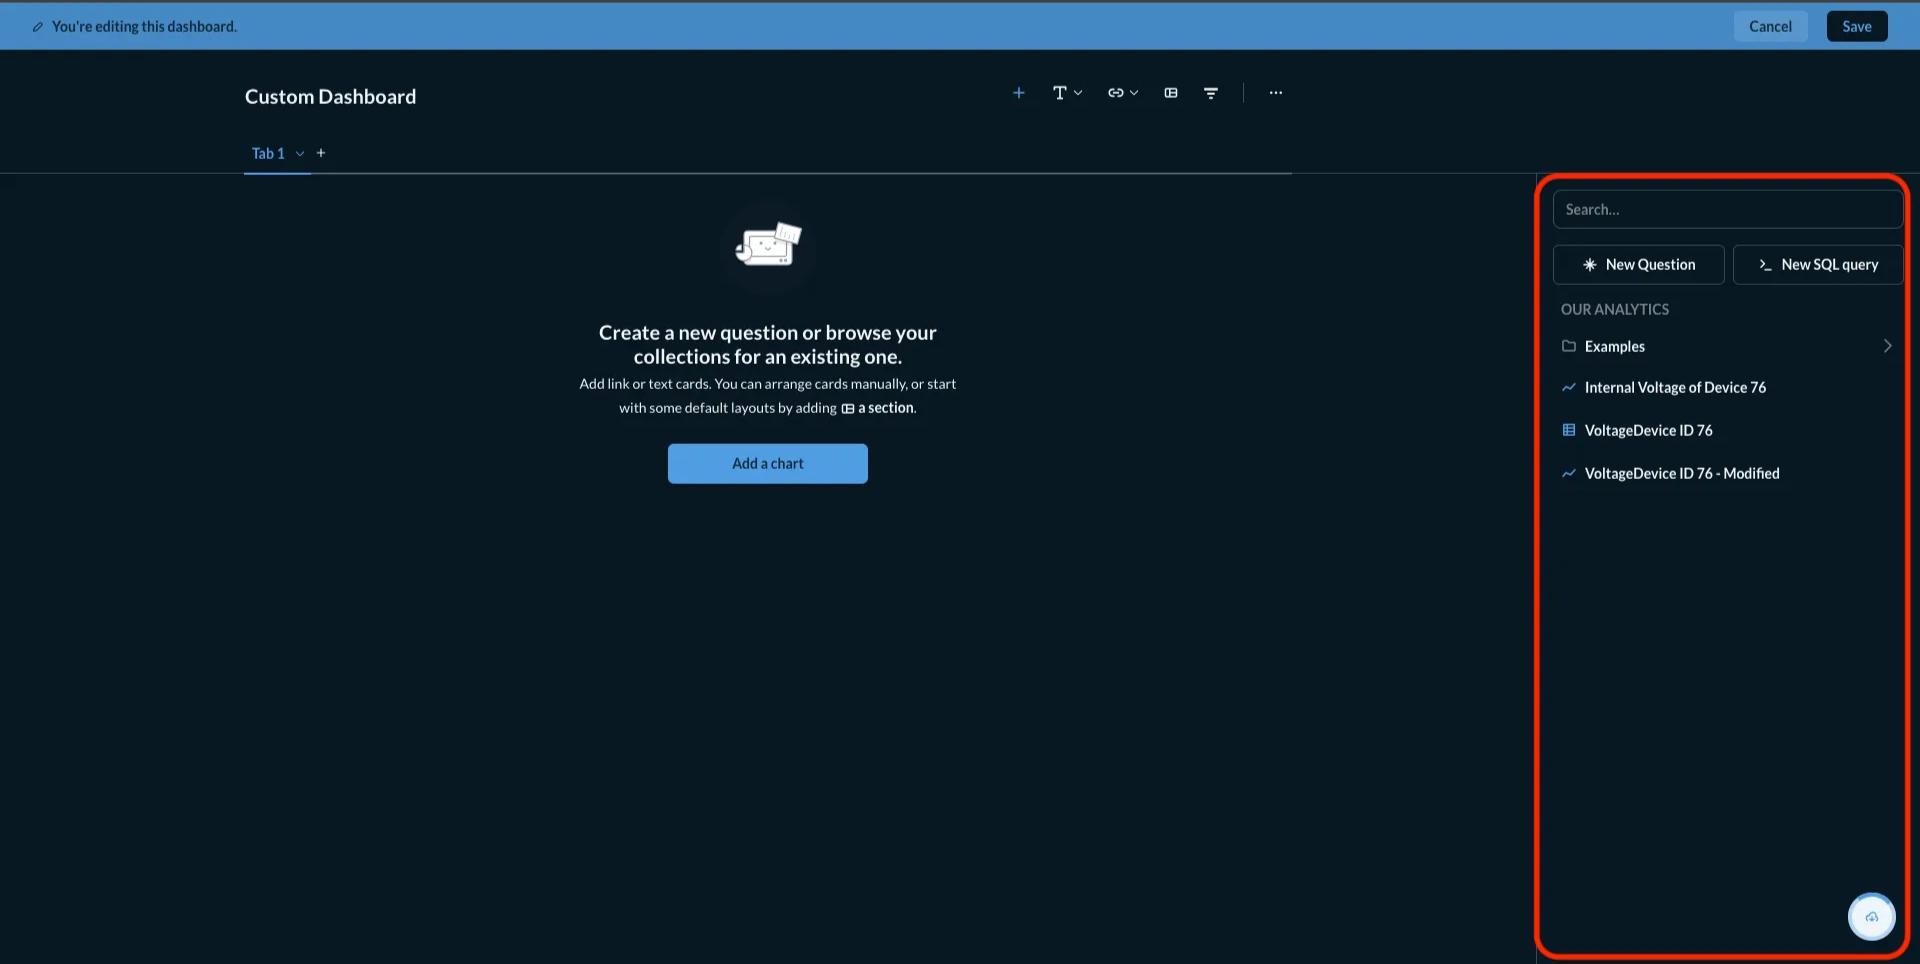
From the Side Bar you can choose from:
-
Use a saved SQL query, or
-
Write a new SQL query
-
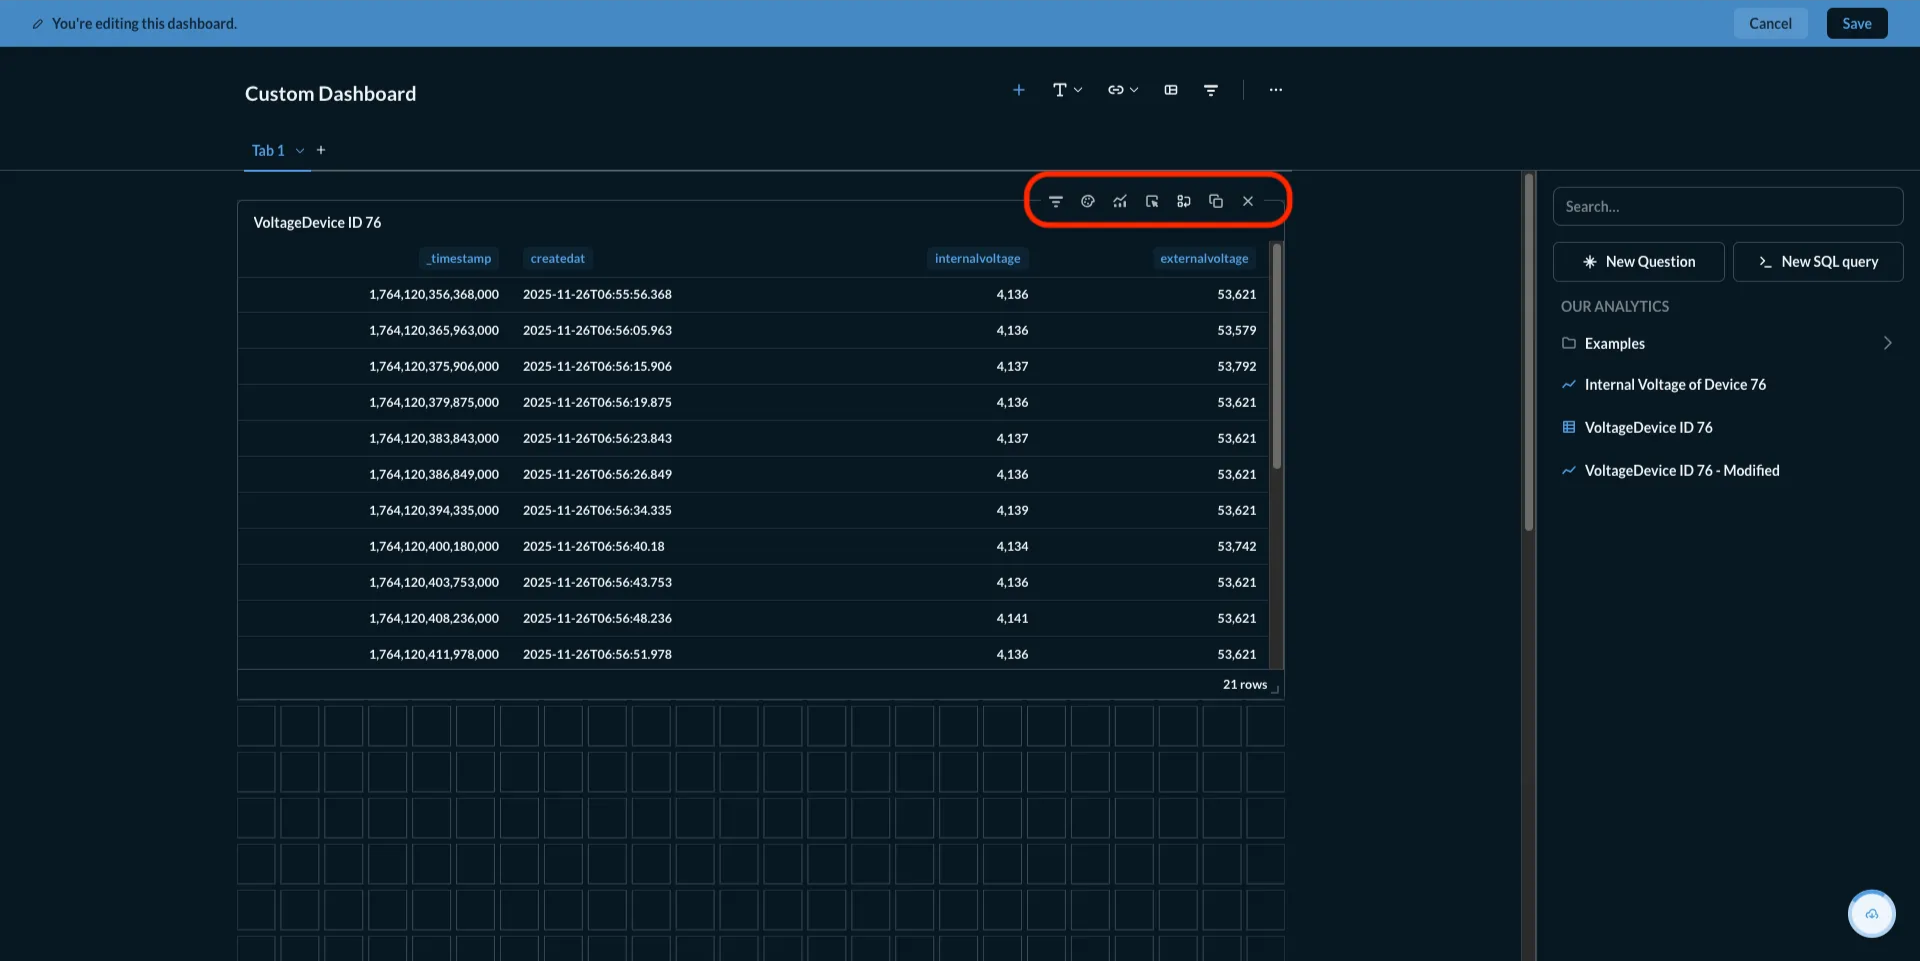
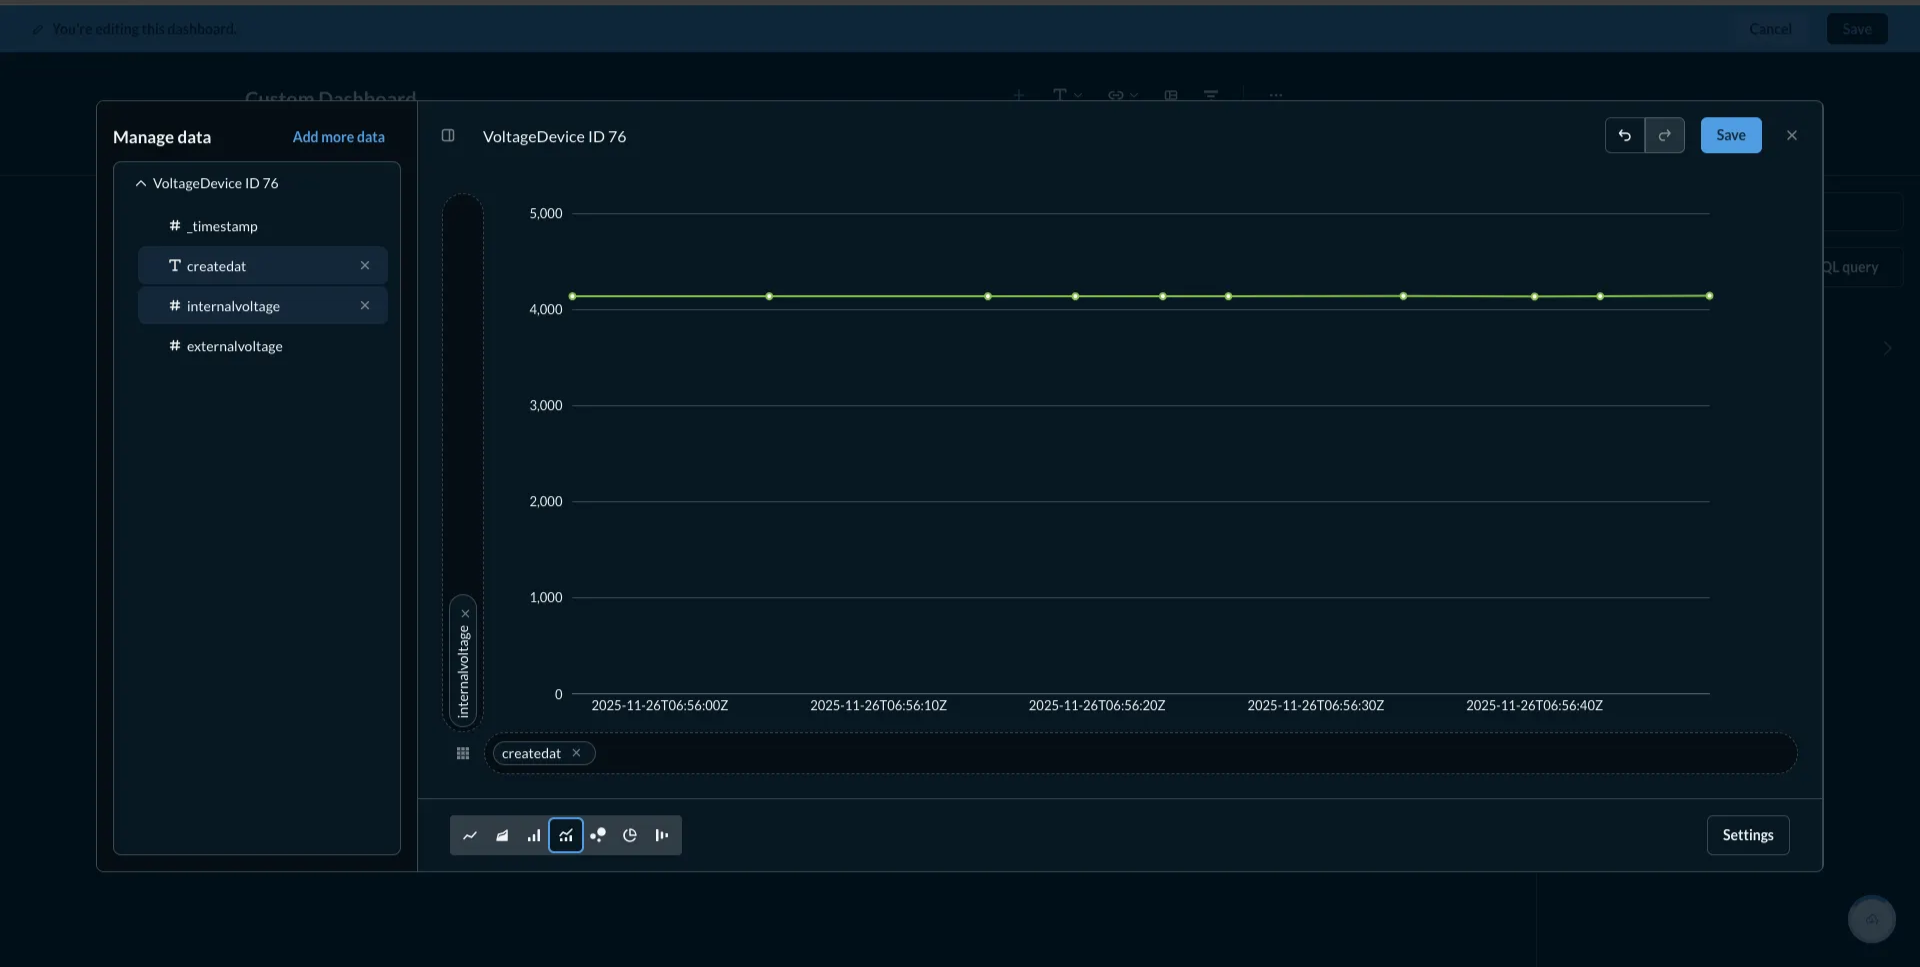
Then Click on the chart icon to visualise the graph
-
Building a Chart
-
Select the chart type you want (line, bar, area, etc.)
-
Use drag‑and‑drop to map:
- X‑axis: e.g.,
createdat - Y‑axis: e.g.,
internalvoltageetc.
- X‑axis: e.g.,
-
Once satisfied, click Save.
5. Managing the Metabase Container
Stop Metabase:
docker compose down
Update Metabase:
docker pull metabase/metabase
docker compose up -d