Dashboards
Dashboards allow users to create custom views using logs, metrics, and traces to monitor and analyze system data in one place.
Steps to Use It:
-
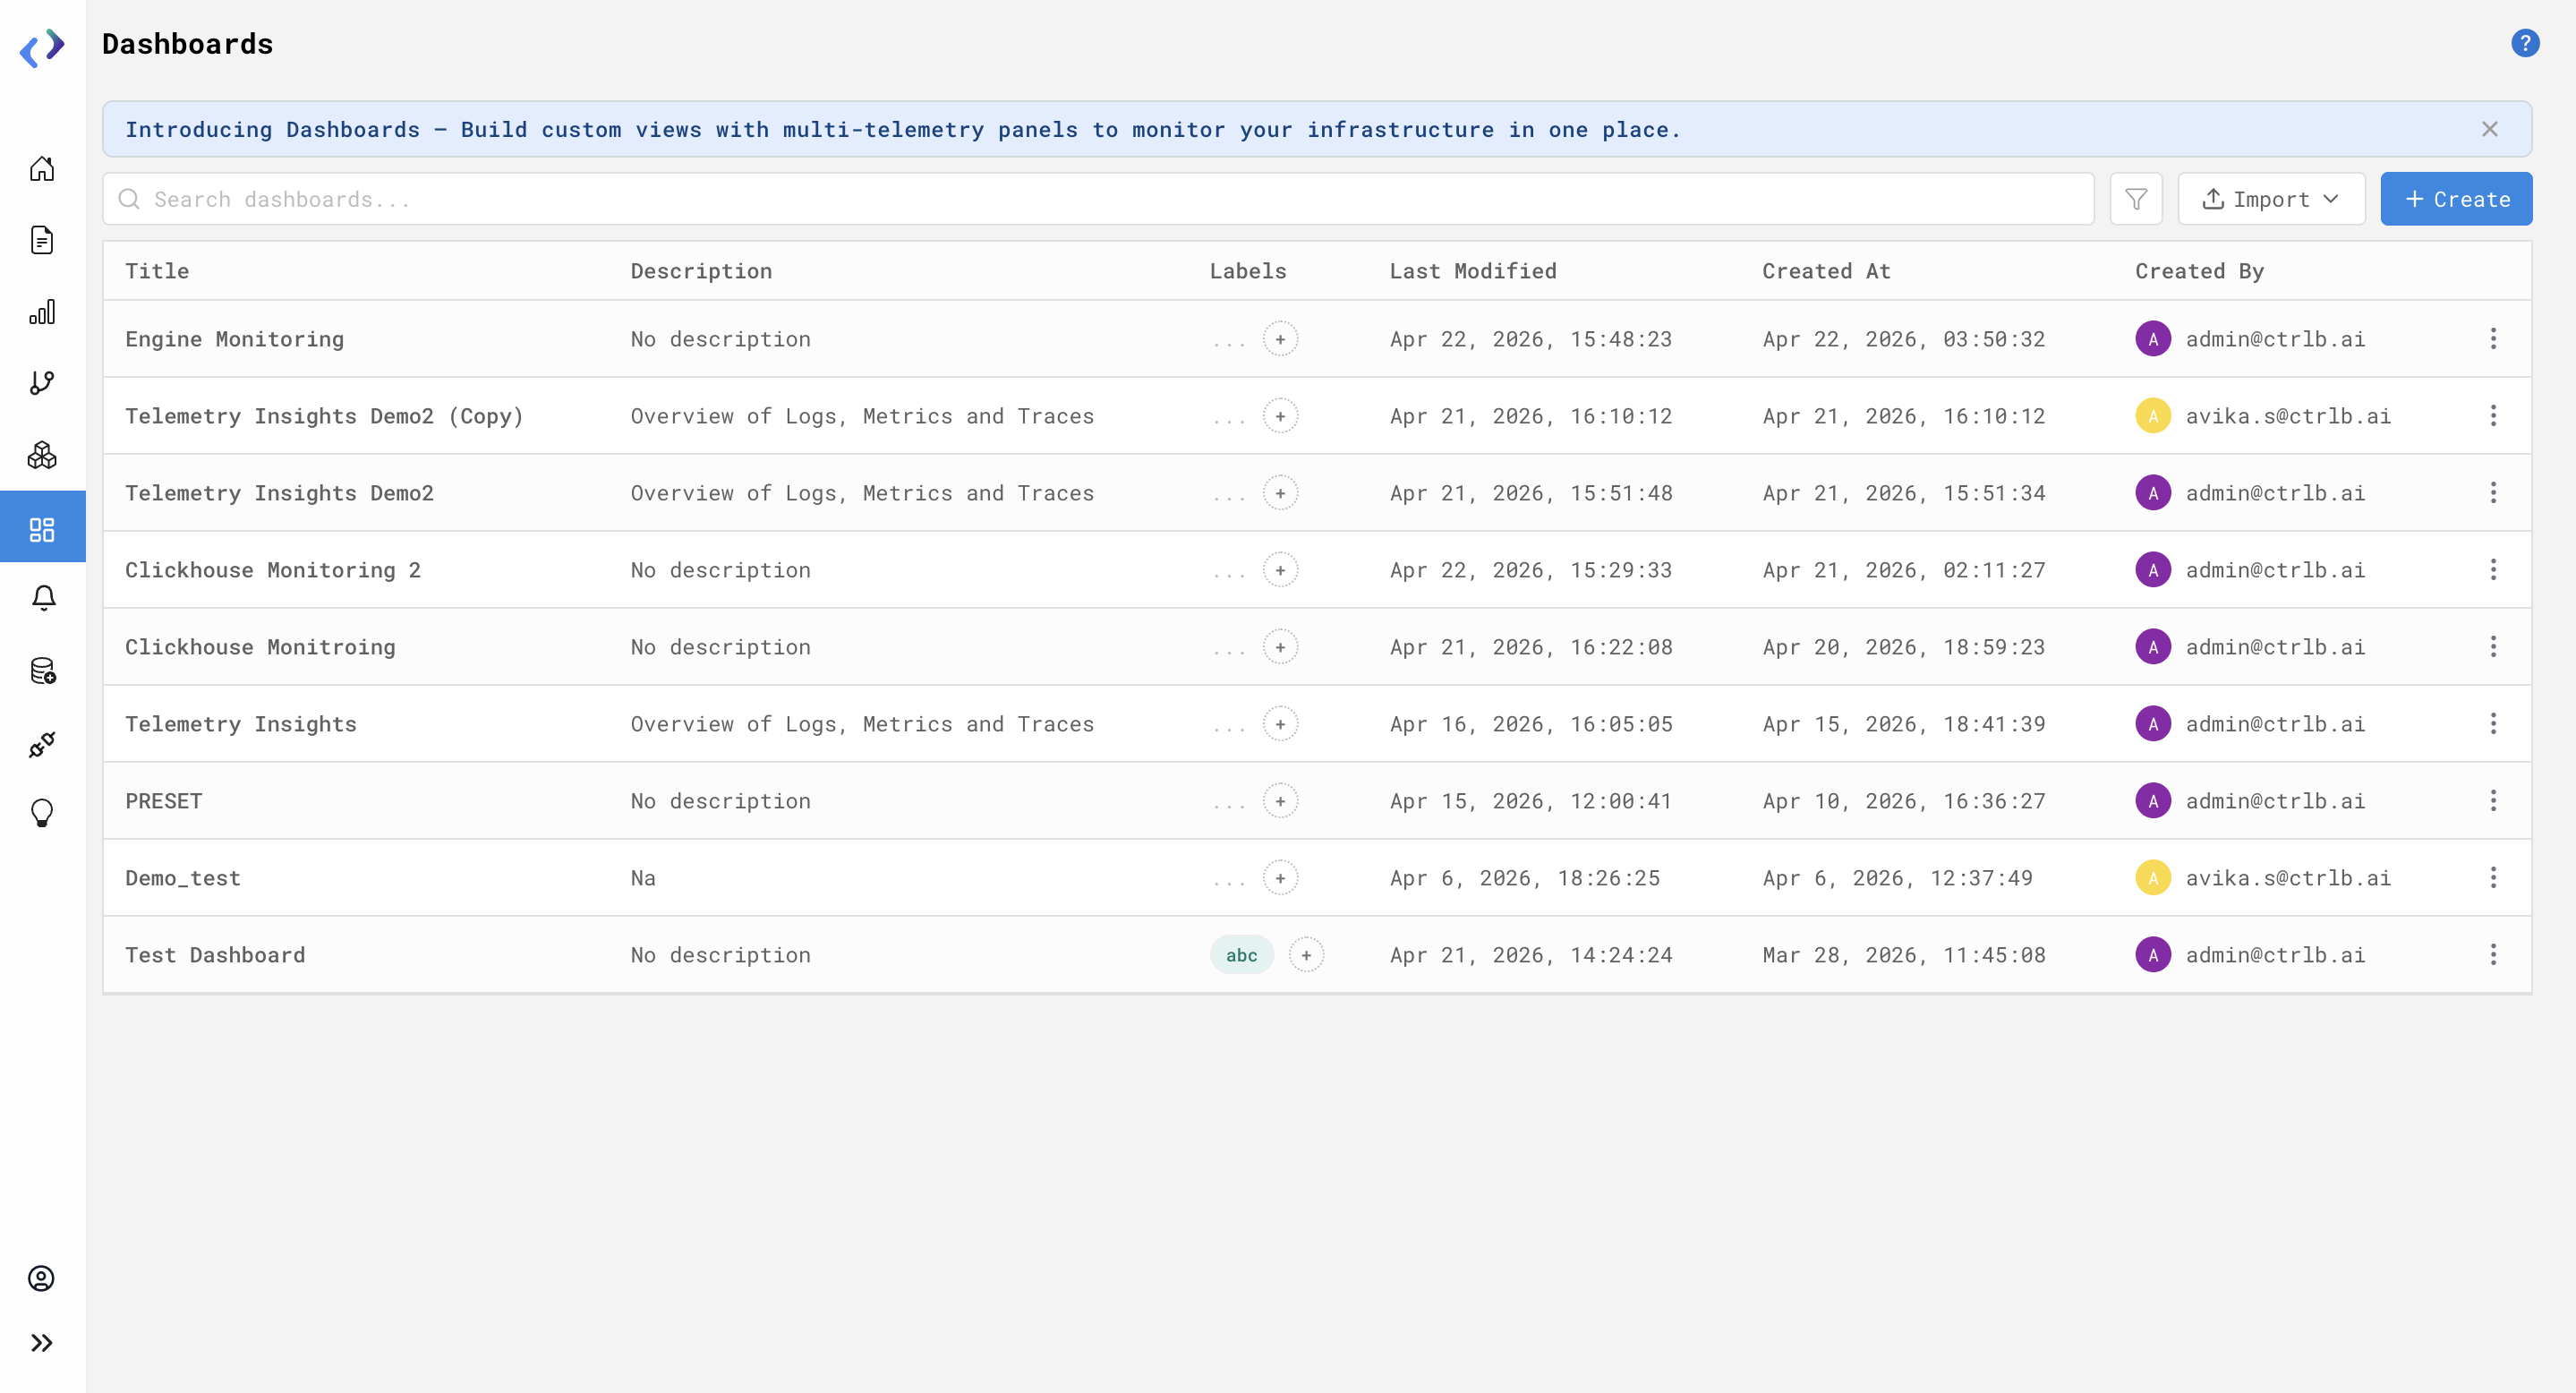
Go to the Dashboards page.
-
View the list of existing dashboards with details like title, description, last modified time, and created by.
-
Click on Create to create a new dashboard.
-
Enter the title and description in the side panel and click on Create Dashboard to open the dashboard editor.
-
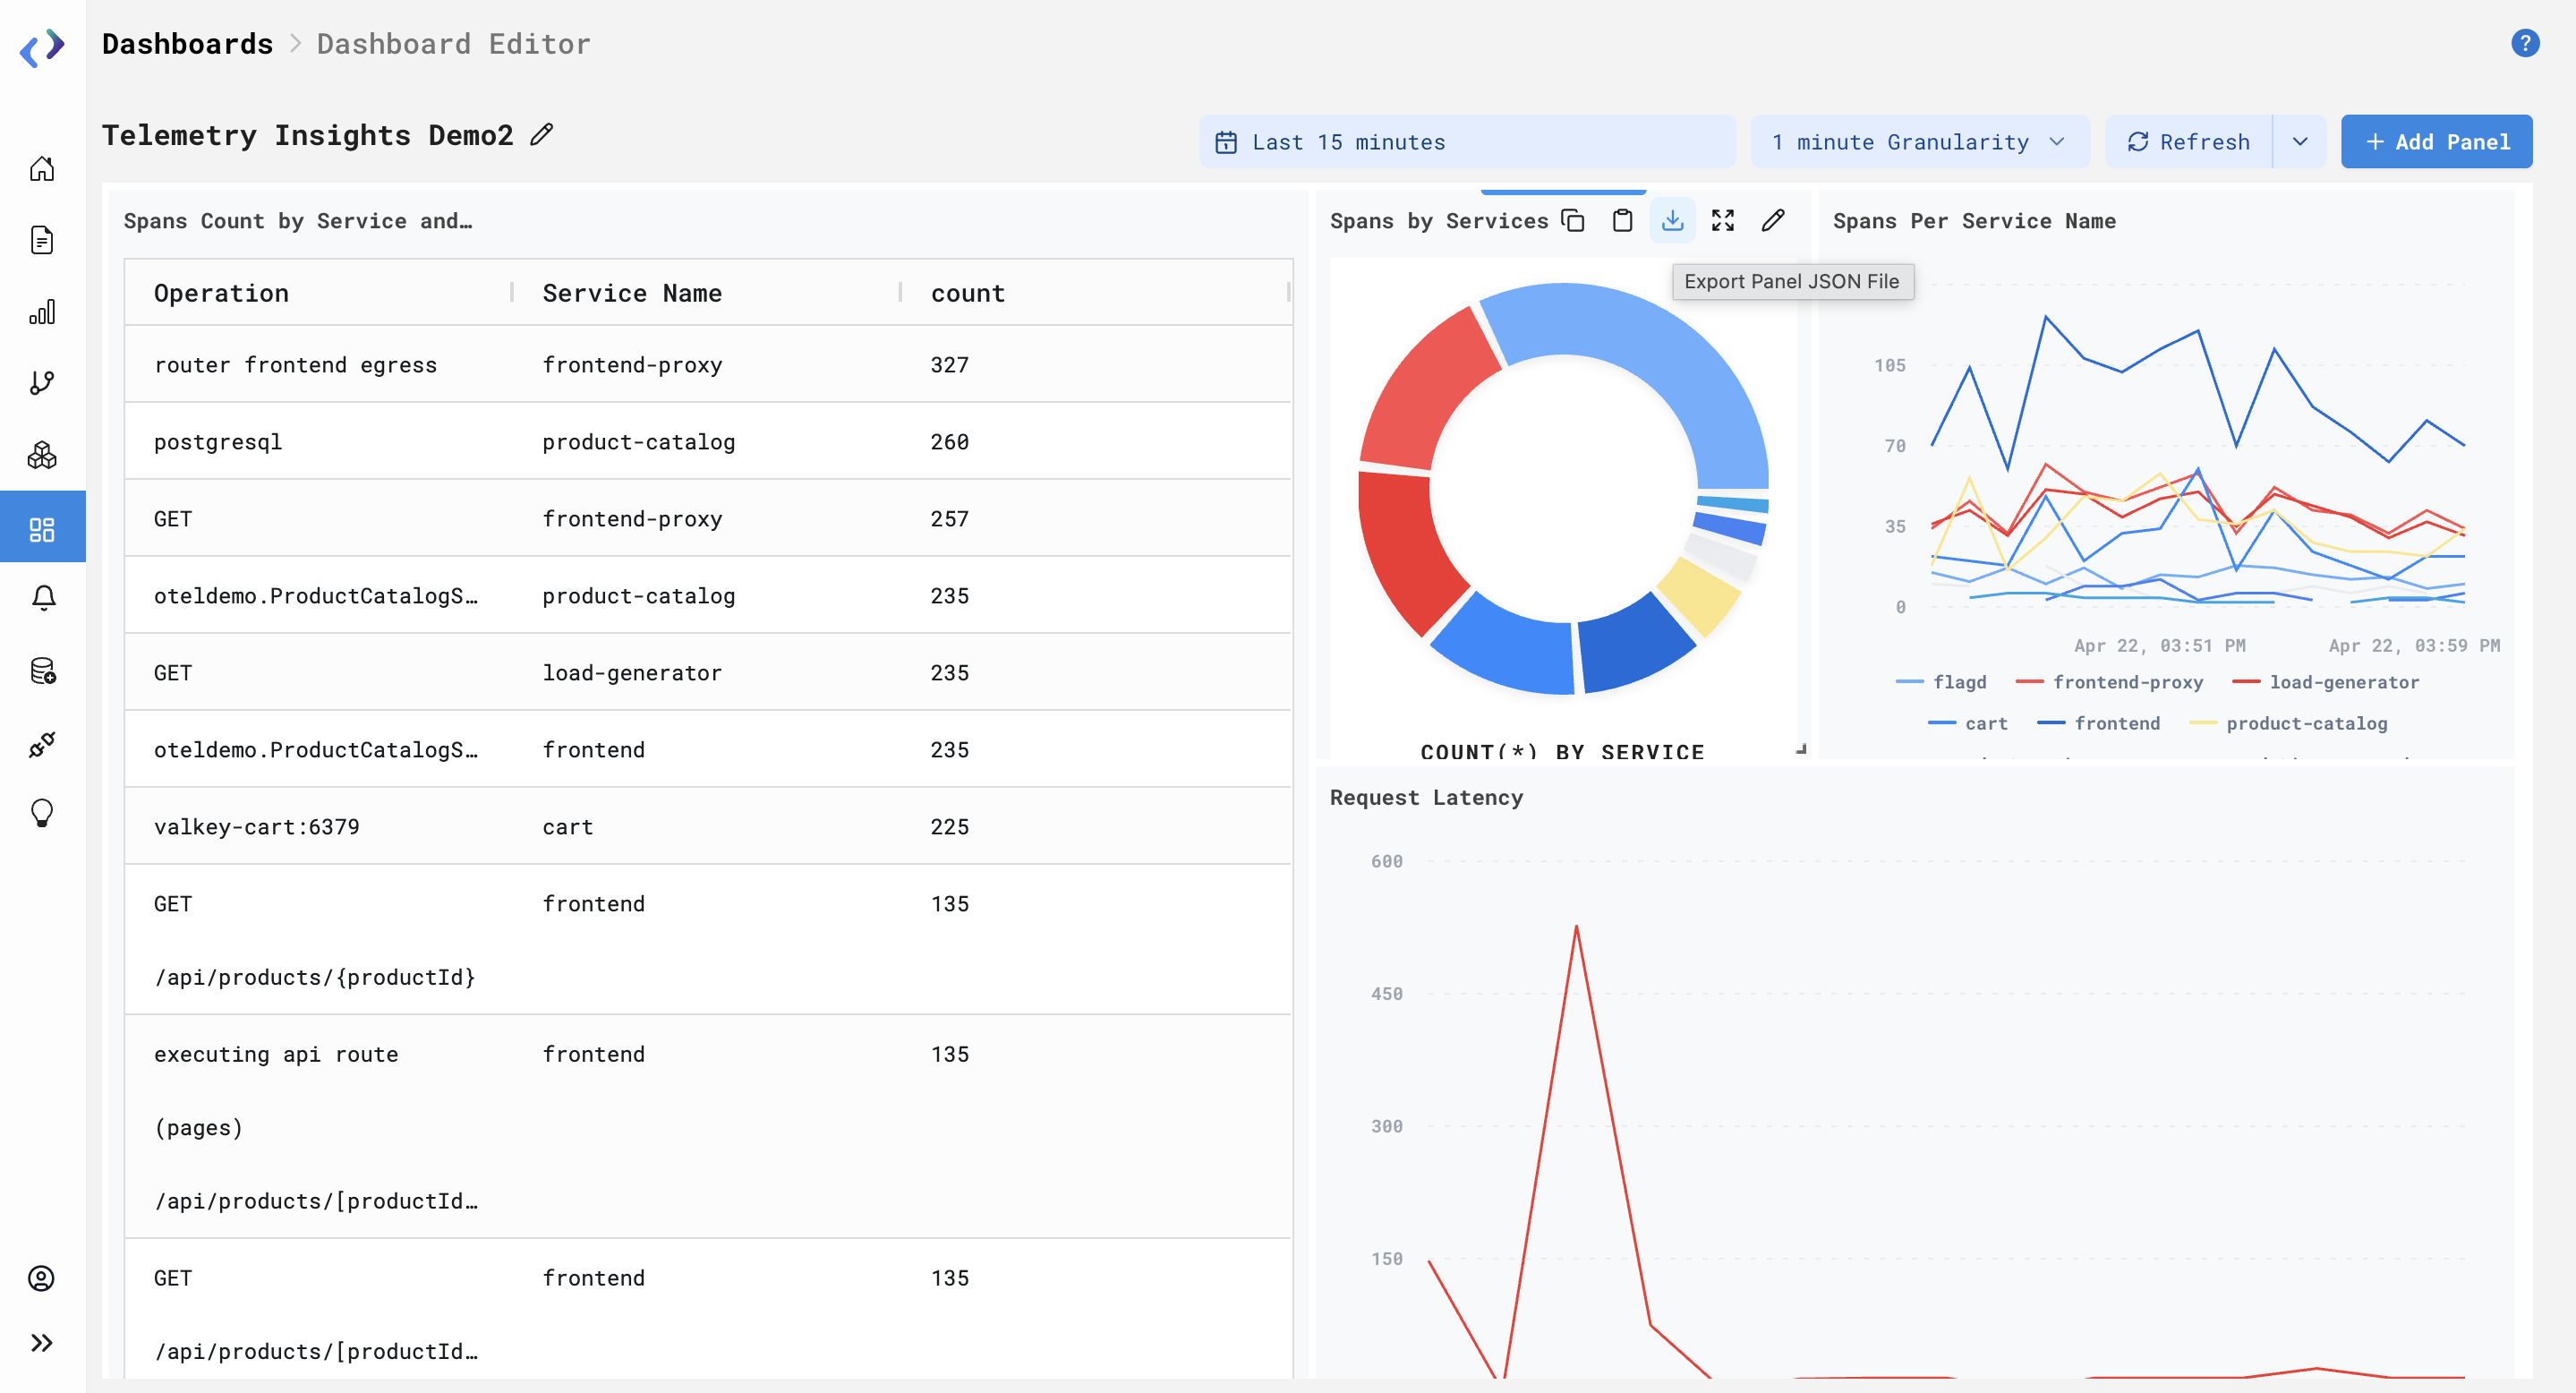
Use the time filter (top-right) to select the desired time range, which applies to all panels in the dashboard.
-
Click on Add Panel to add a new panel.
-
Select the data type (Logs, Metrics, Traces) and choose the dataset.
-
Build your query using the query builder and select a visualization type (line, bar, table, number, pie, Json).
-
Click on Run Query to preview the data.
-
Click on Save Panel to add the panel to the dashboard.
-
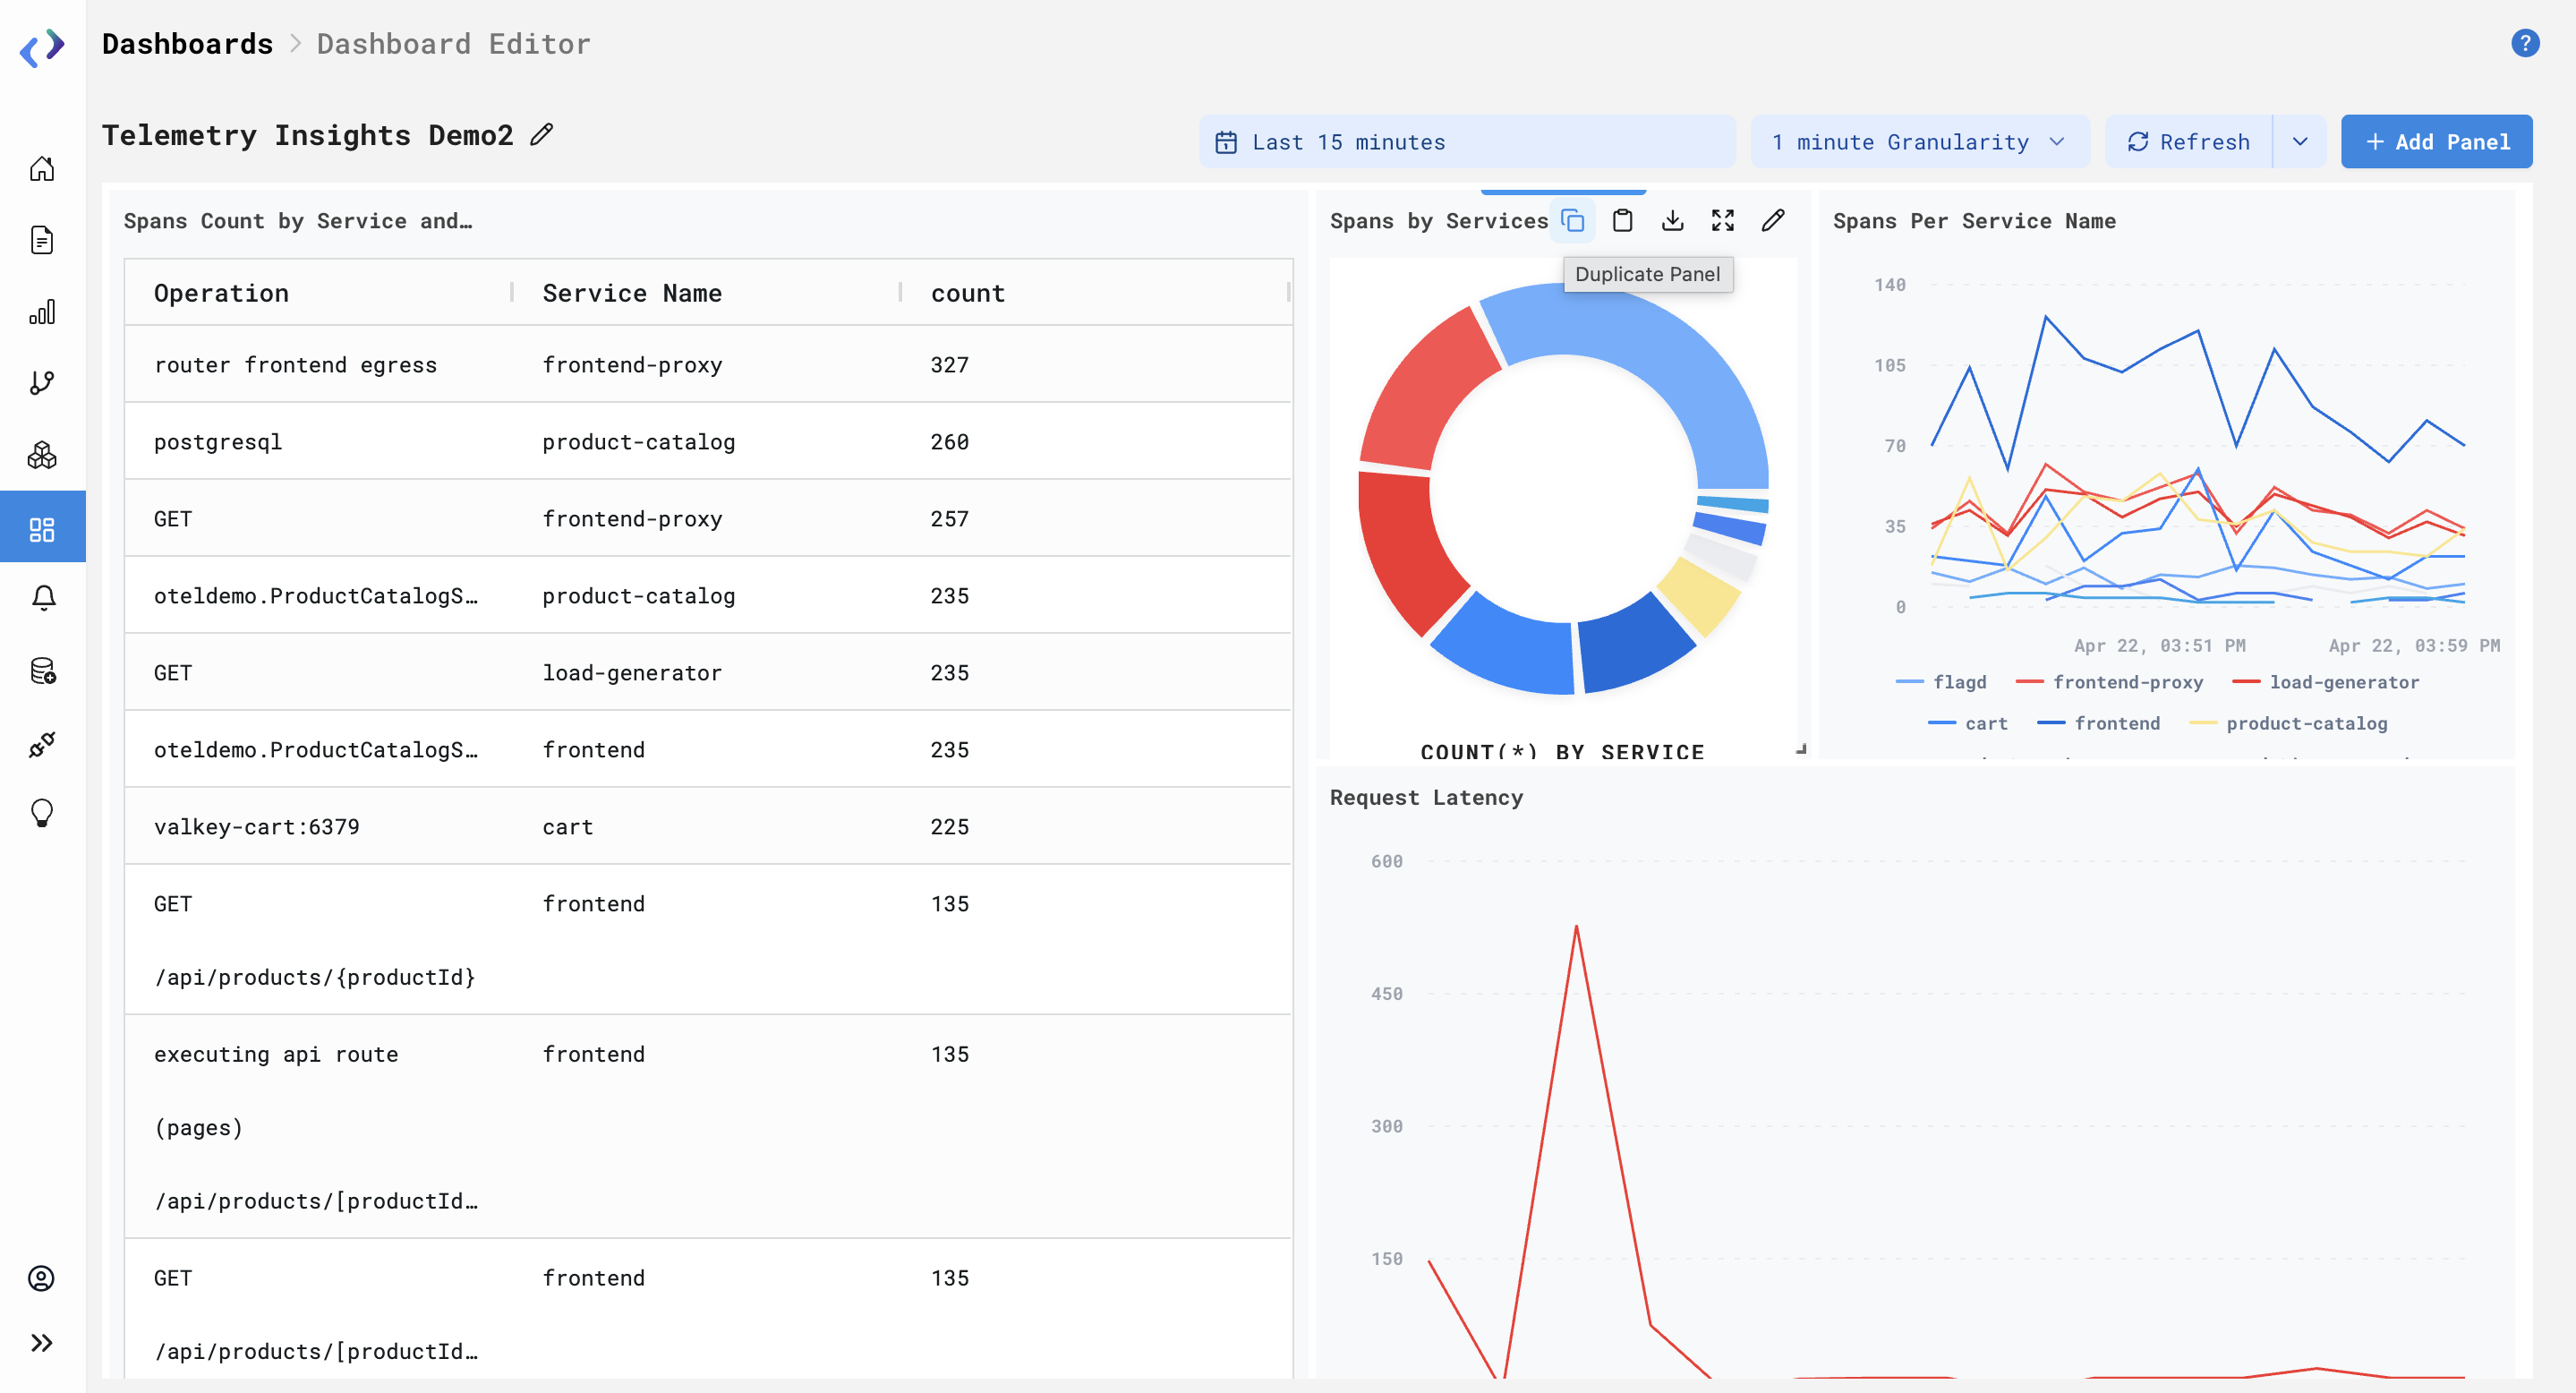
Manage panels using panel actions such as edit, duplicate, resize, or delete.
-
Use the action menu (three dots) on a dashboard to perform operations like View, Export to Clipboard, Export to File, Clone, Edit, and Delete.
-
To duplicate a dashboard, use Clone Export to Clipboard and then use Import to recreate it button/icon.
-
Preset dashboards – Services, Telemetry Insights.
-
To export a pannel to any other platfrom use the Export in json file (download icon) button.
Availability:
All users