Features
1. SQL MODE
- Enables developers to run complex SQL analytical queries on CtrlB
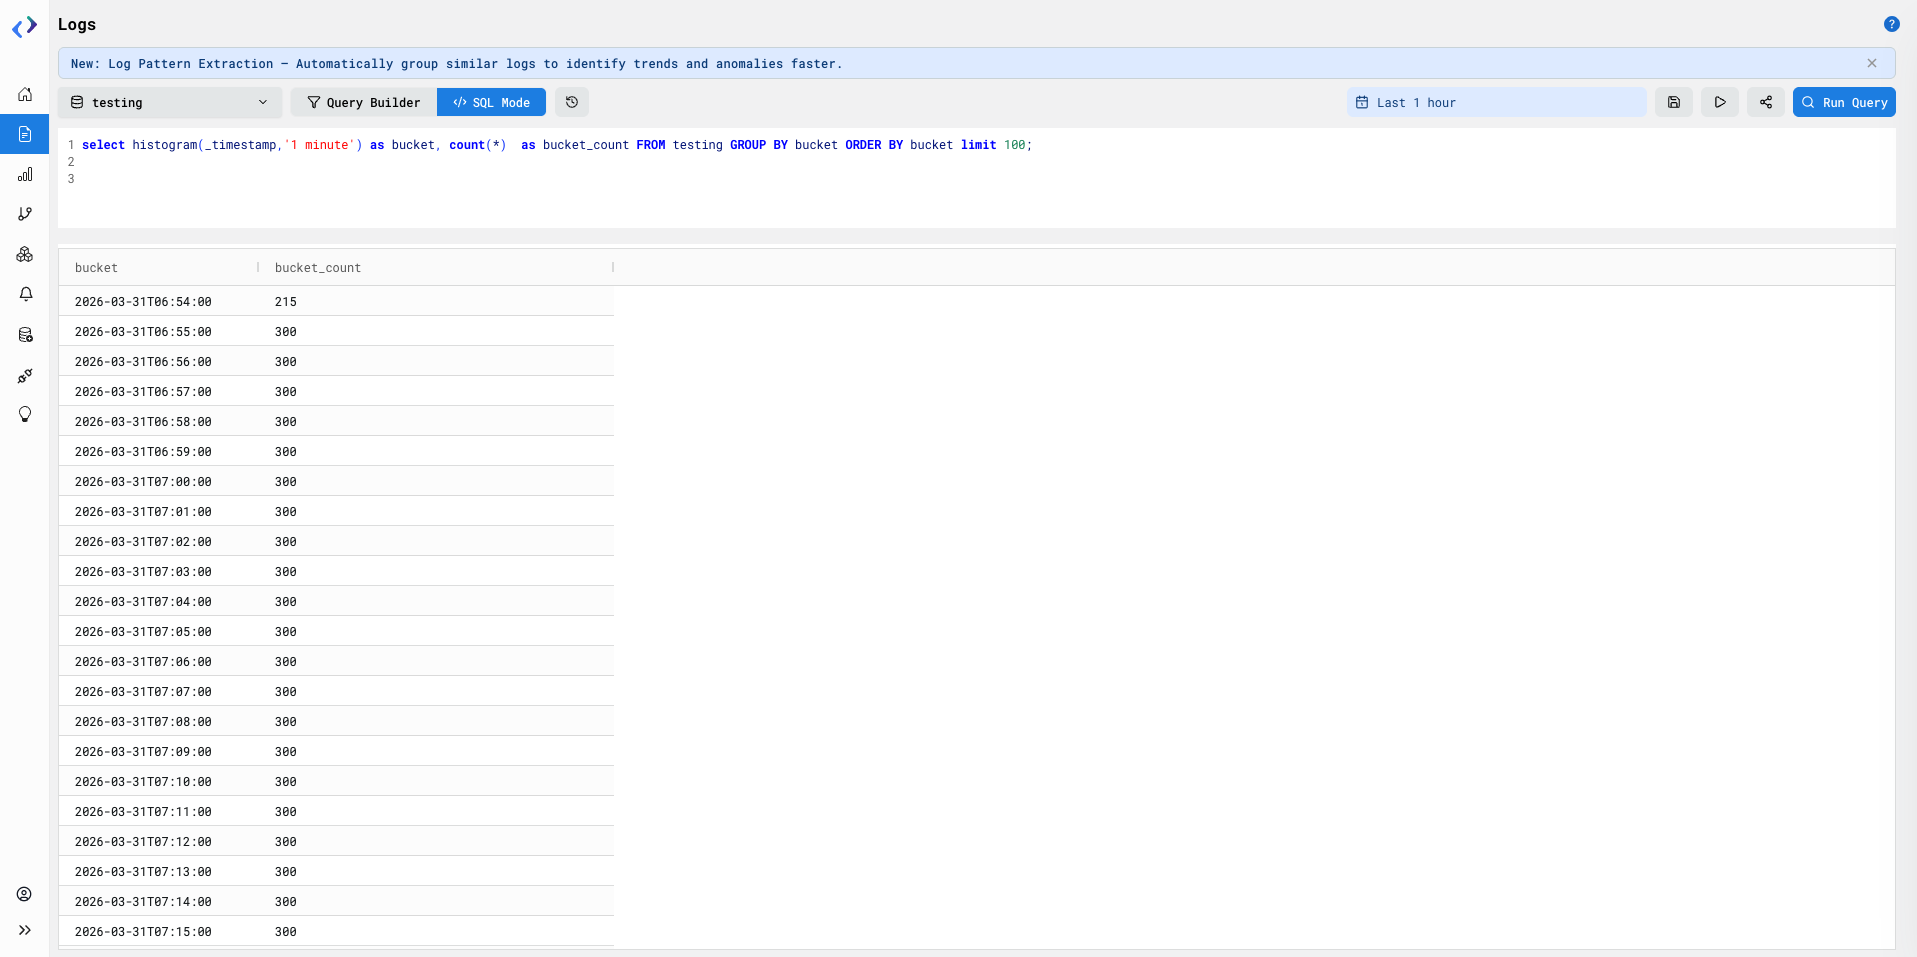
Steps To Use
- Shift from default ‘Query Builder’ tab to ‘SQL’ tab
- Type in any complex analytical SQL directly & click on ‘Run Query’
2. QUICK MODE
Improve your query speed with quick mode; query only the important fields you want
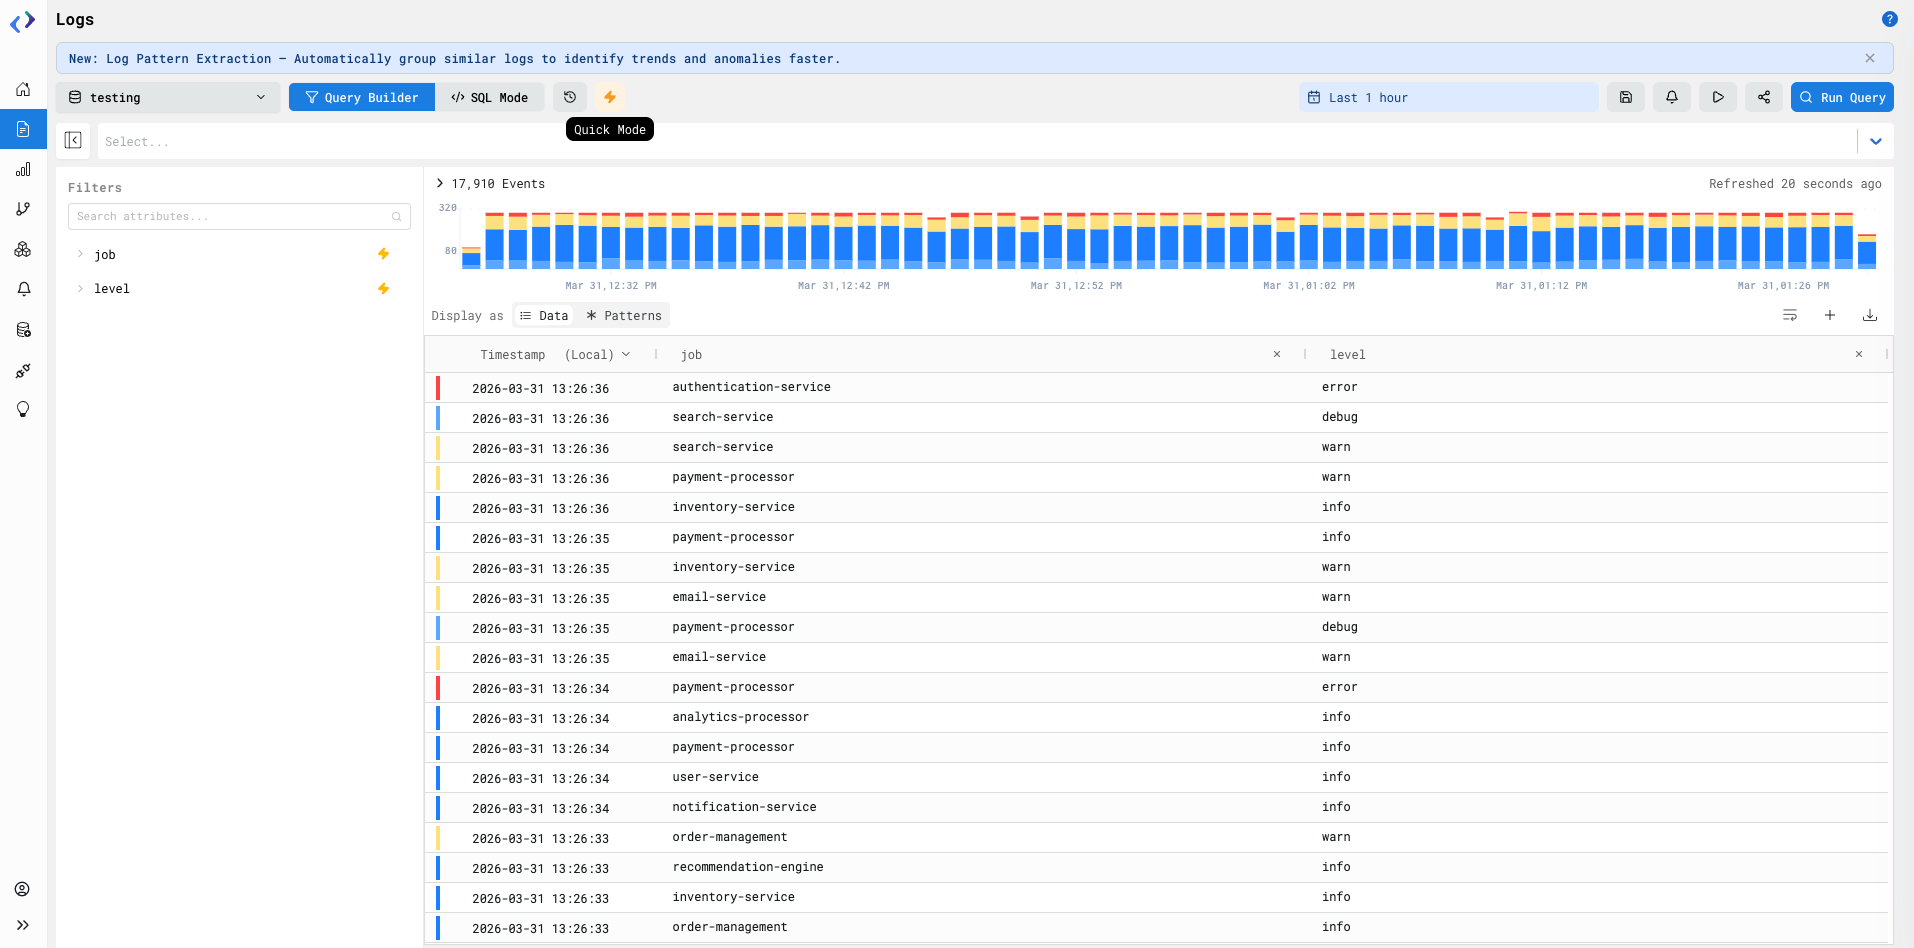
Steps To Use
- Enable Quick mode toggle
- Select the important fields from Attribute Side panel at LHS by clicking on the ‘Lightning’ icon next to the fileds
- Then ‘Run Query’ to experience faster queries
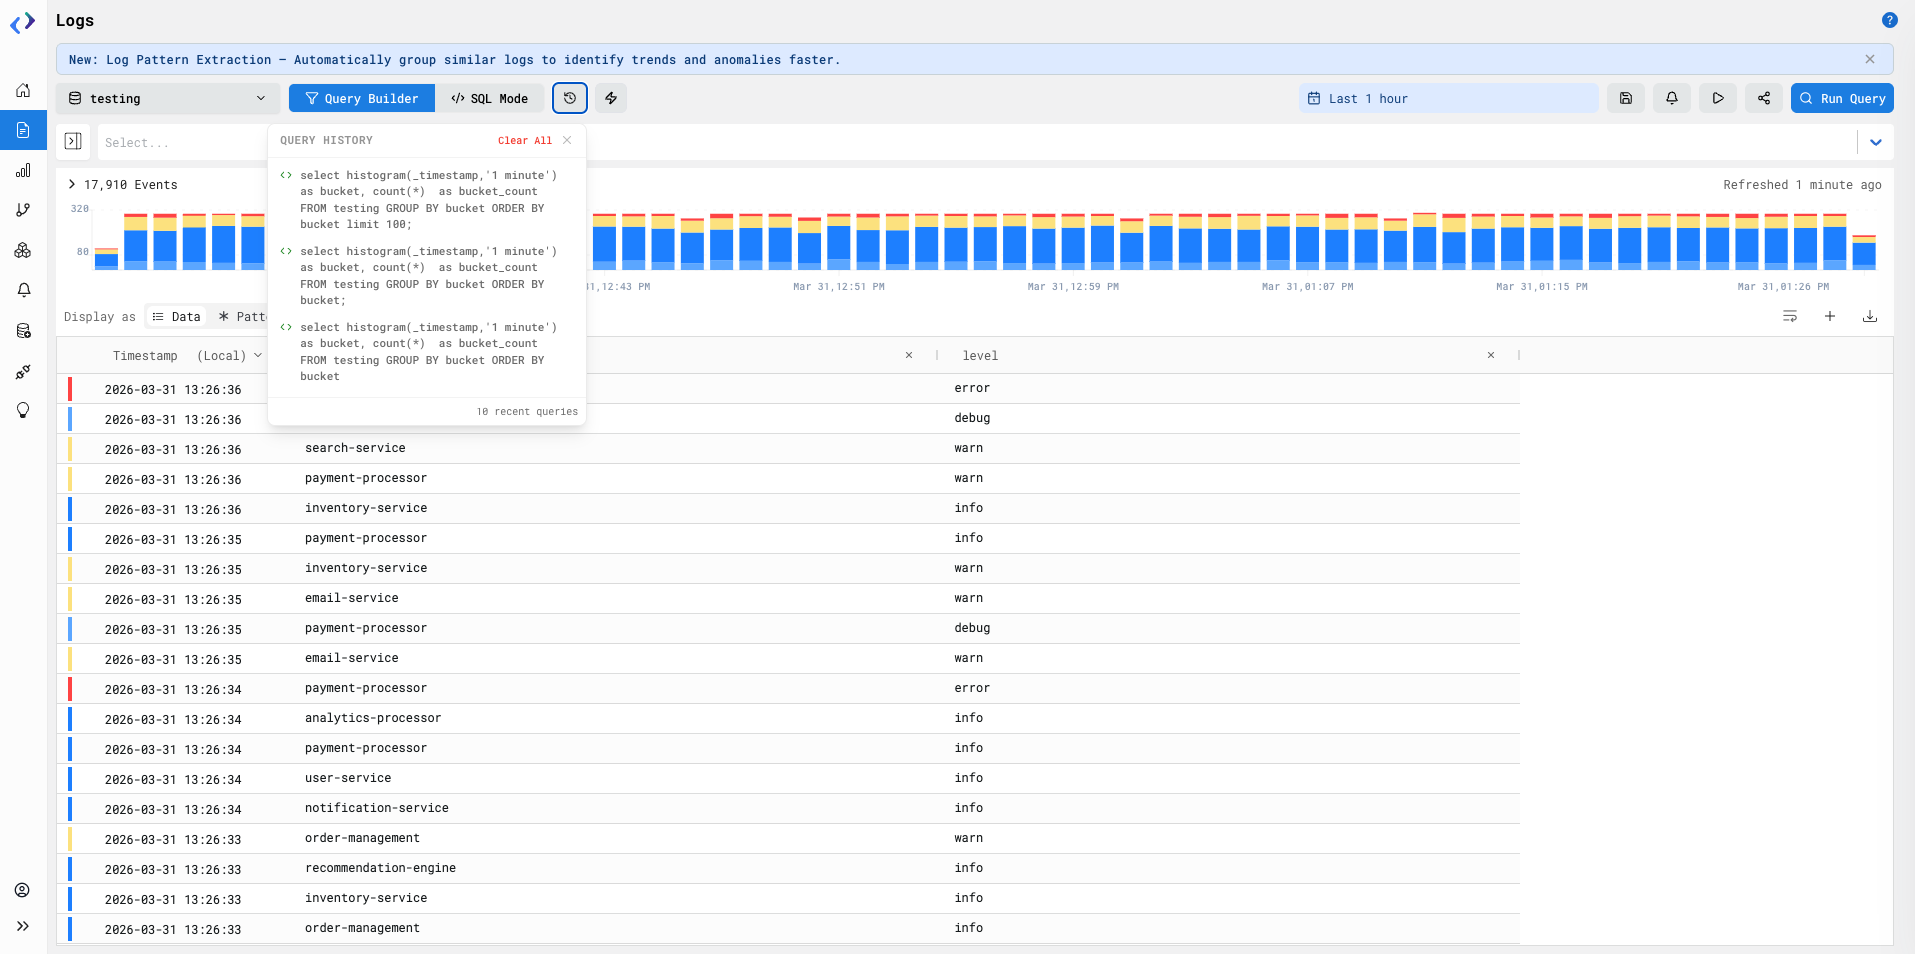
3. Recent Queries
Access past run queries directly from here and avoid typing same queries again
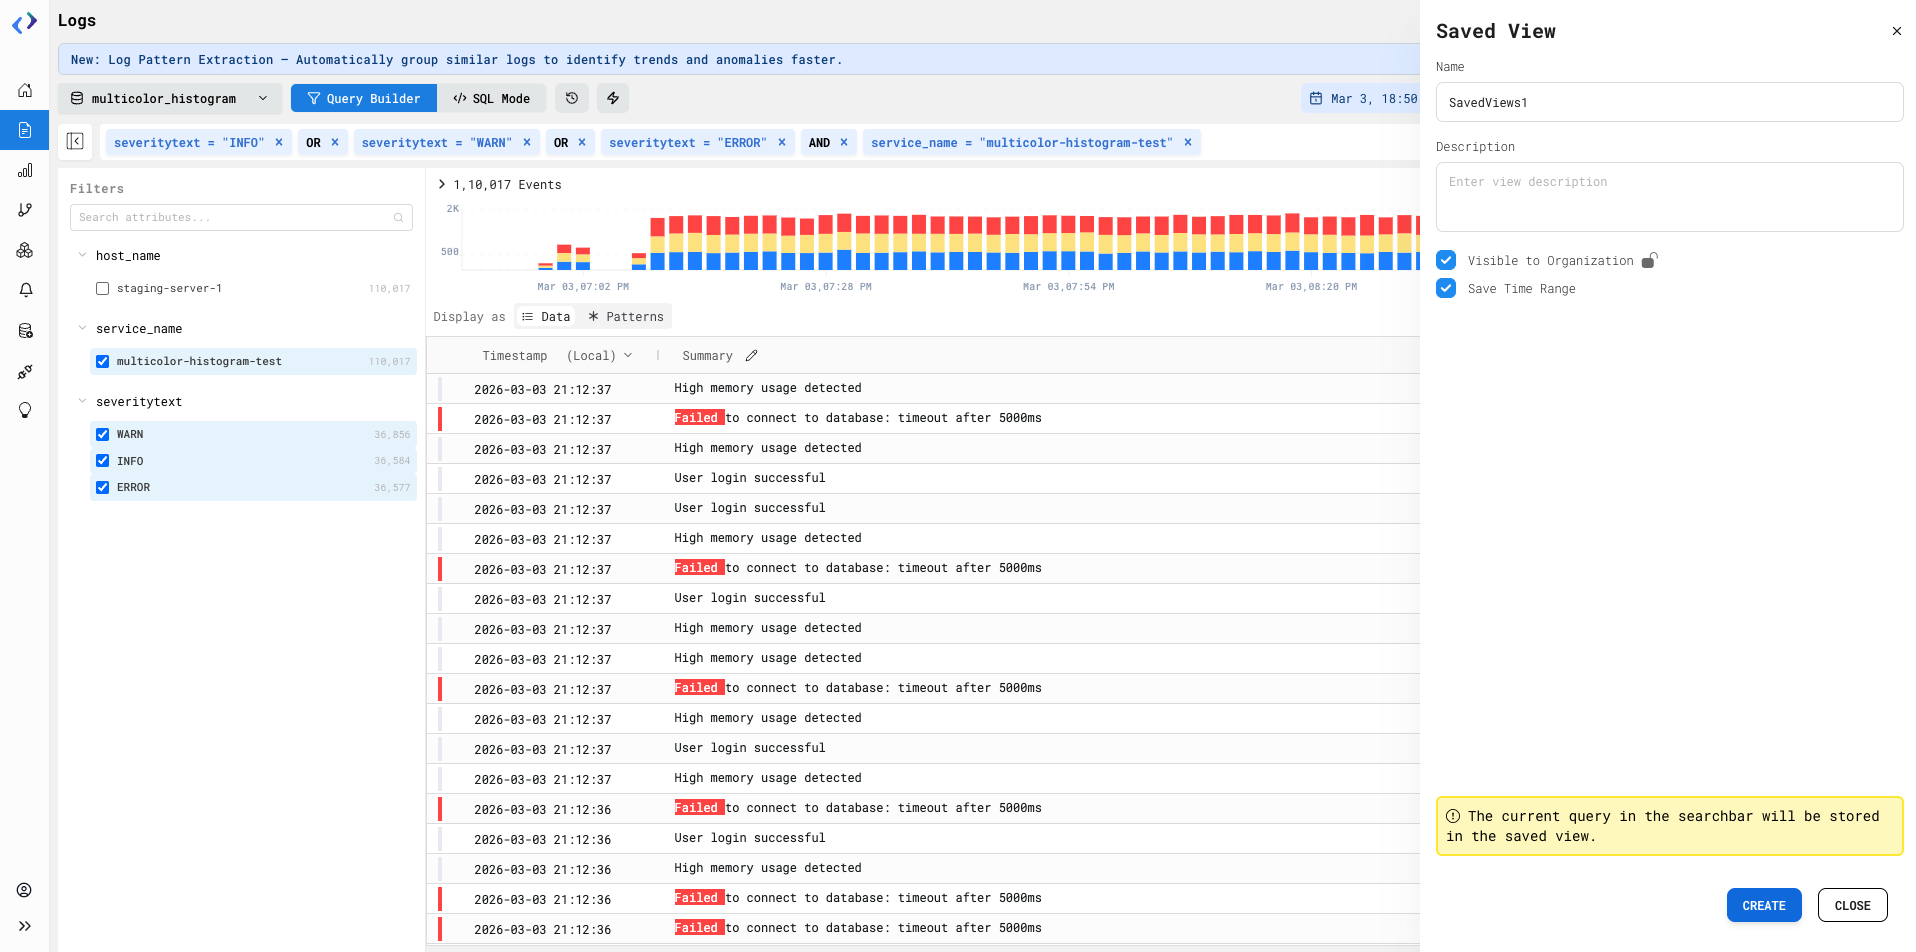
4. Saved View
- If a set of particular query filters are used repeatdly then the user can save the query.
- User can choose to keep it private or public by enabling the 'Visible to Organization'.
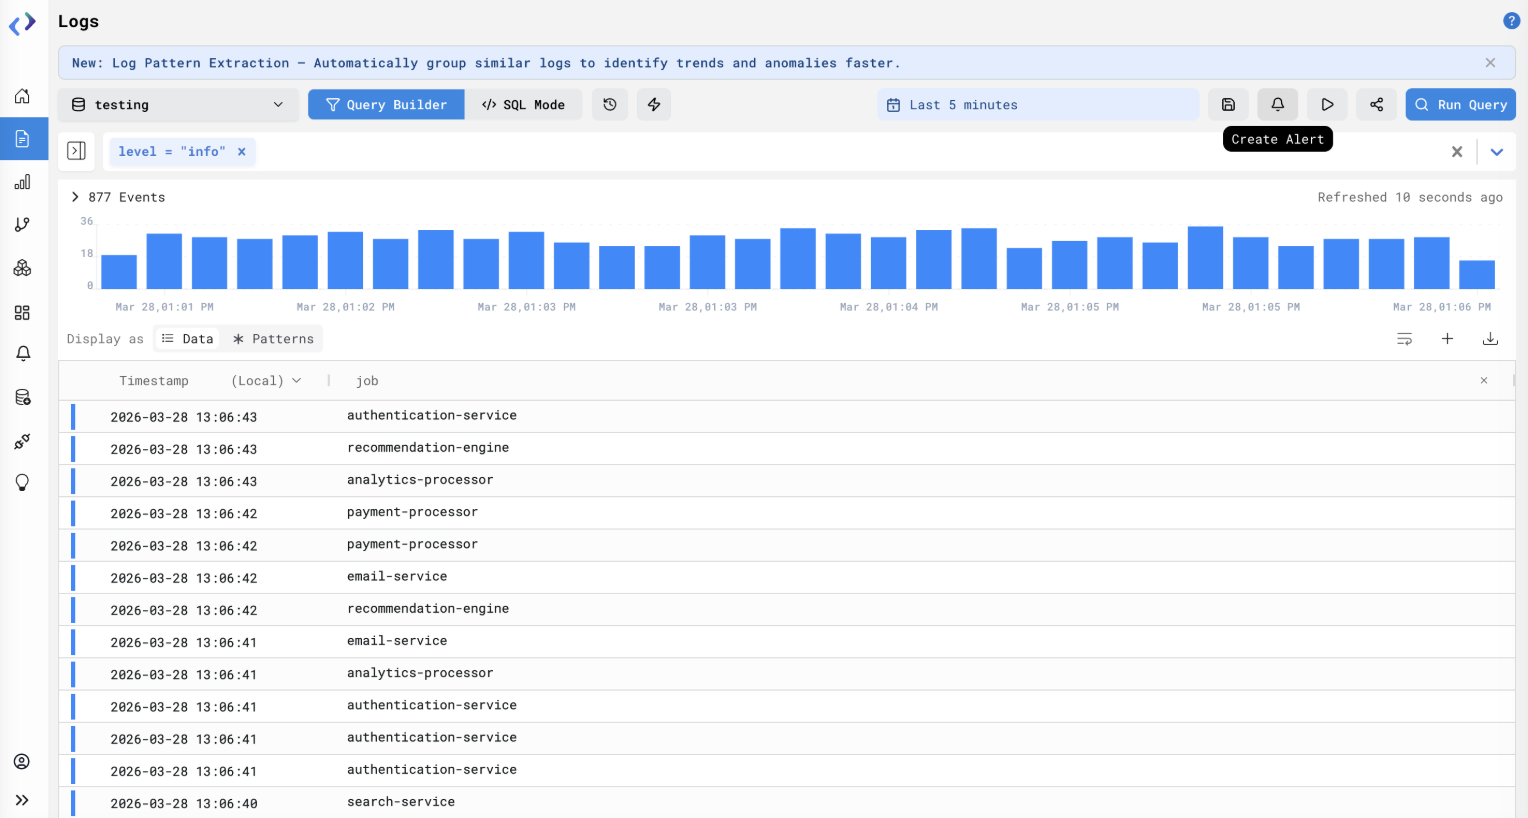
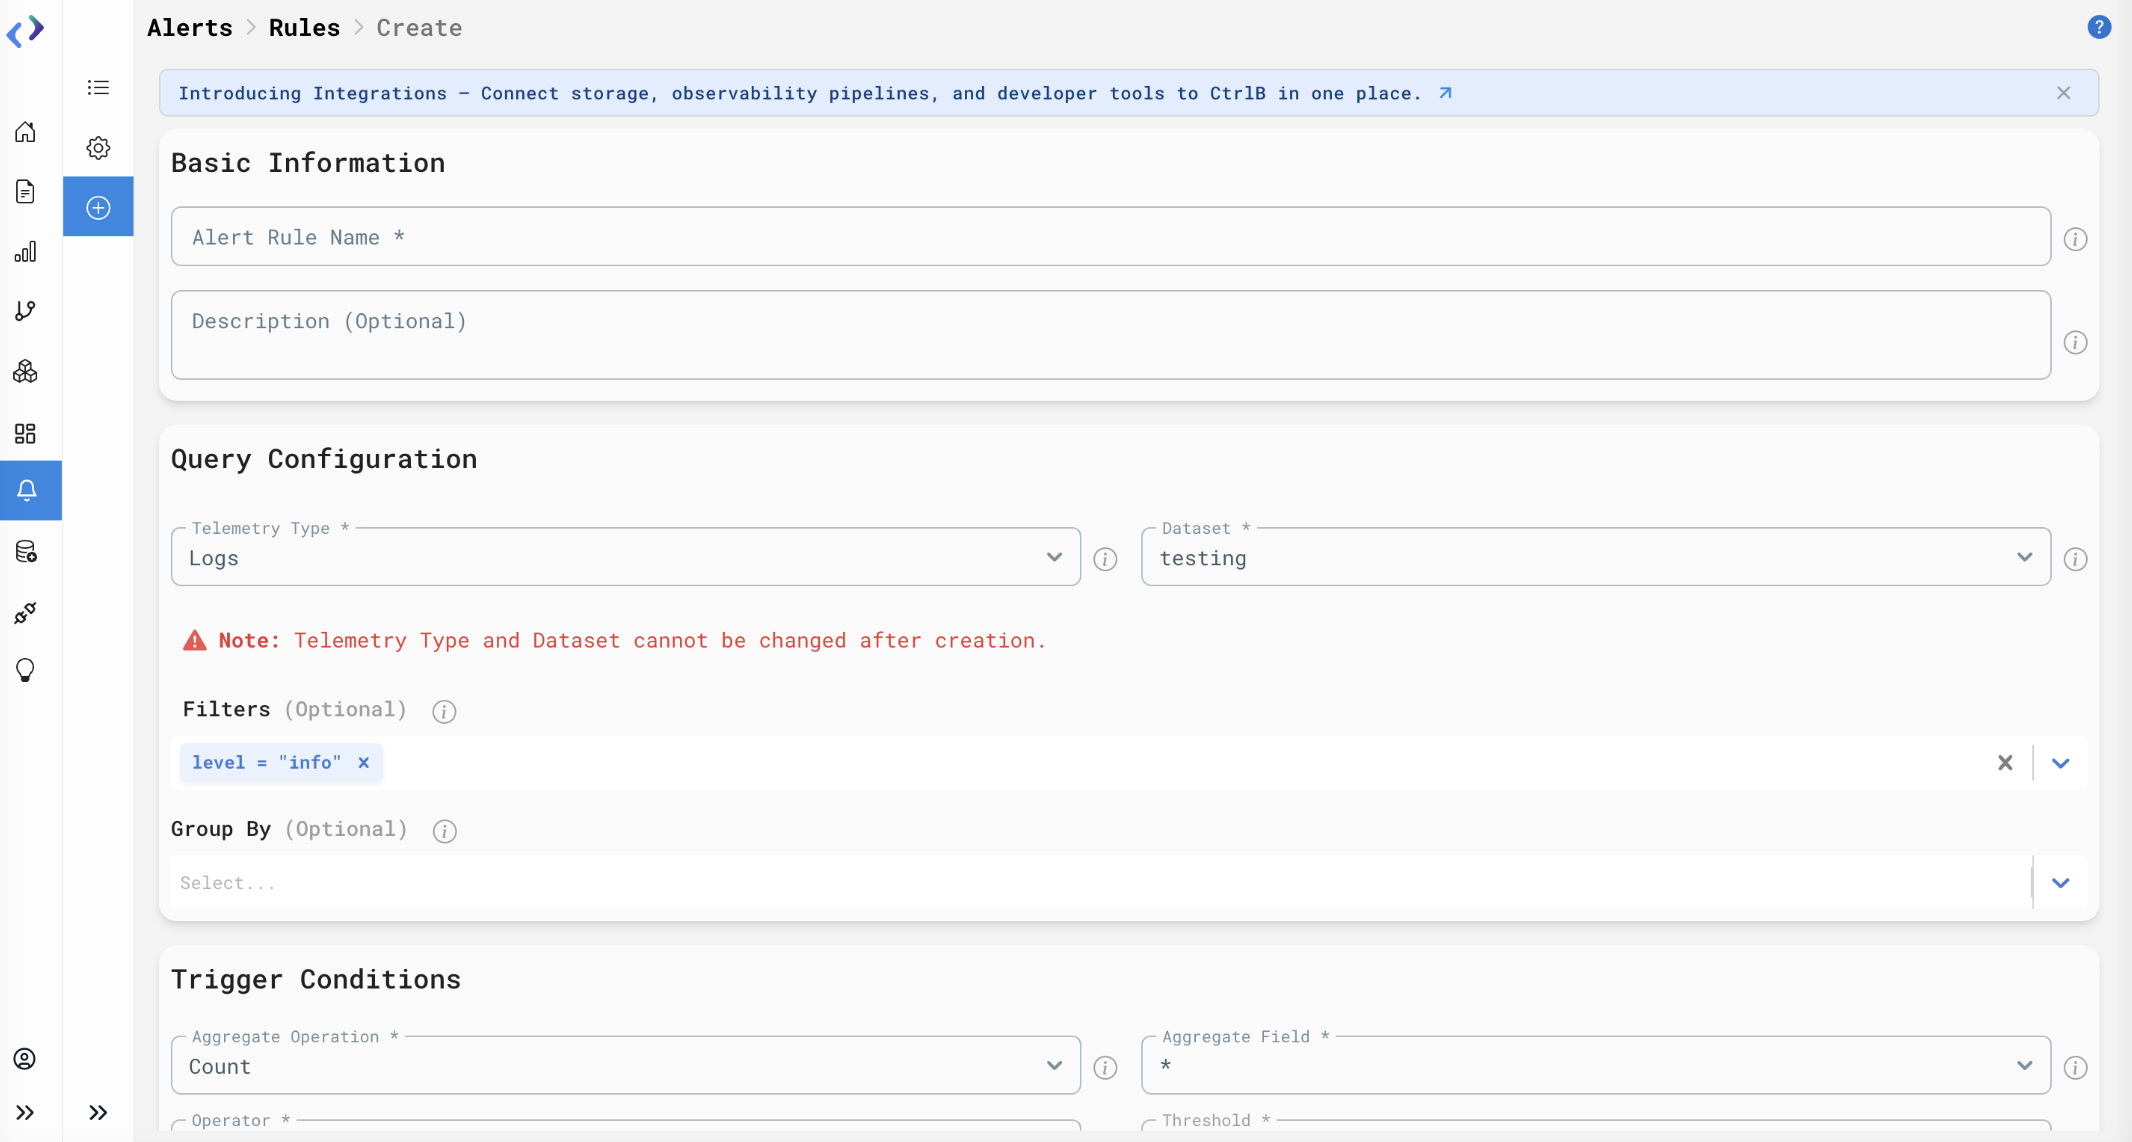
5. Create Alert Rules Directly from the Logs Page
Create alert rules directly from the Logs page using existing queries and filters without reconfiguring them manually in Create Alert page
Steps To Use
- Build a query in the Logs page using Query Builder Mode
- Click on the bell icon in the top toolbar
- View the alert creation form with pre-populated filters from the current query
- Set threshold, notification channel, and save the alert rule
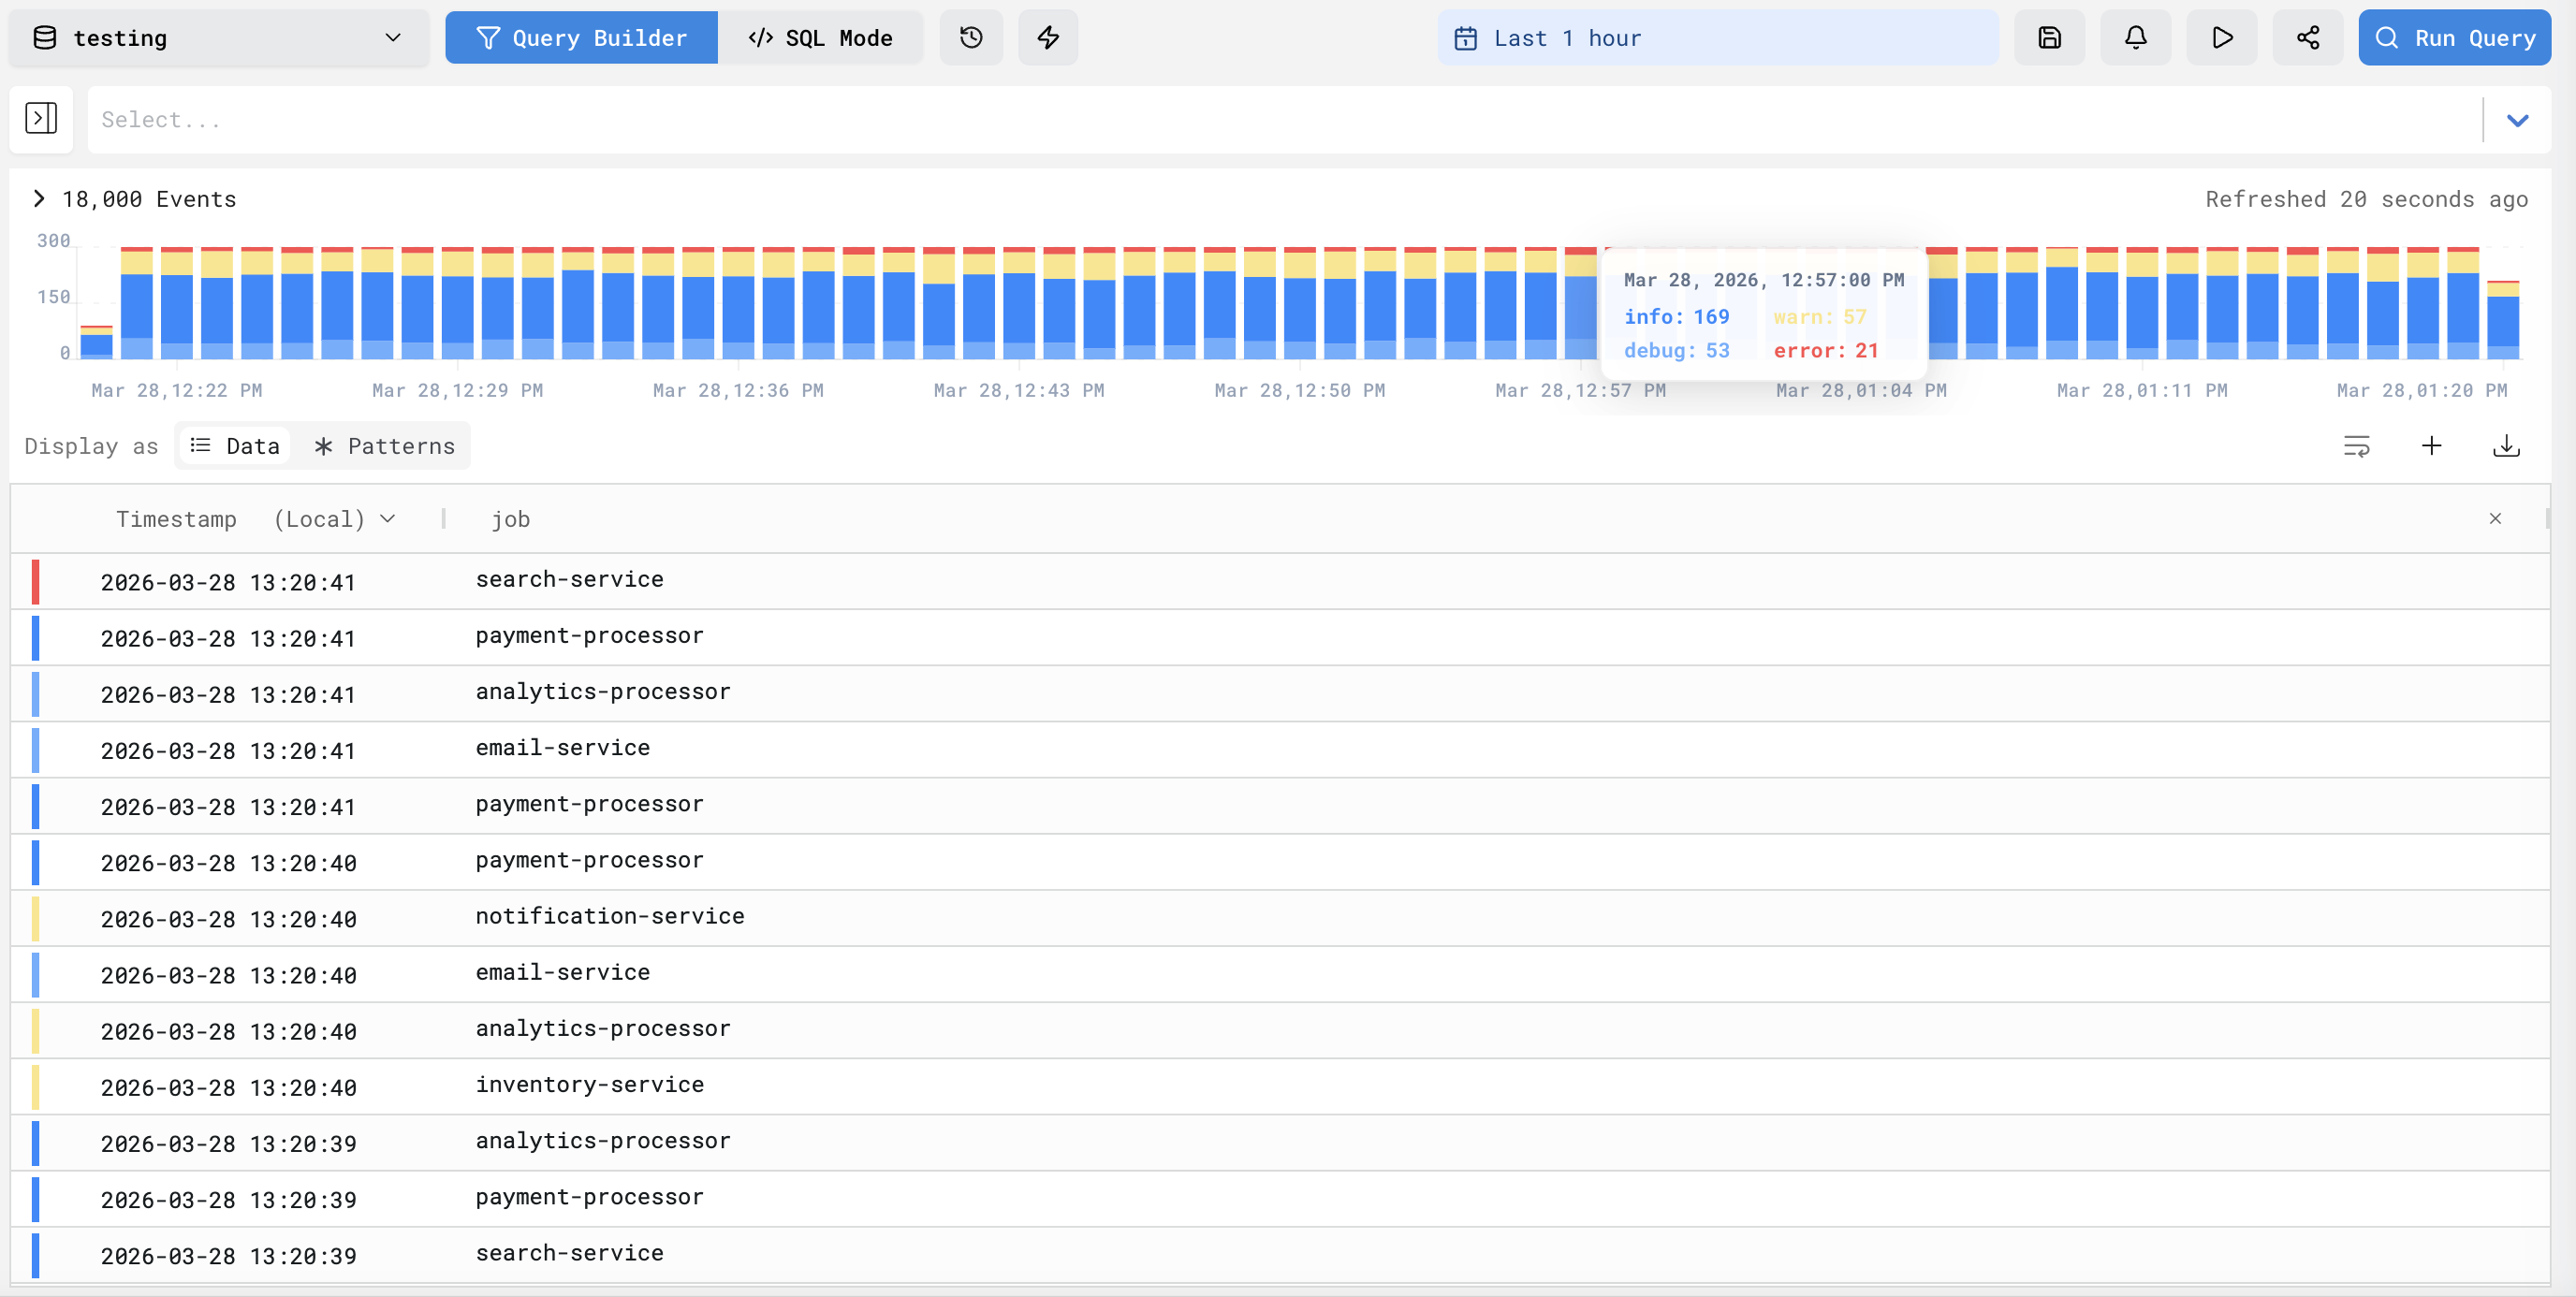
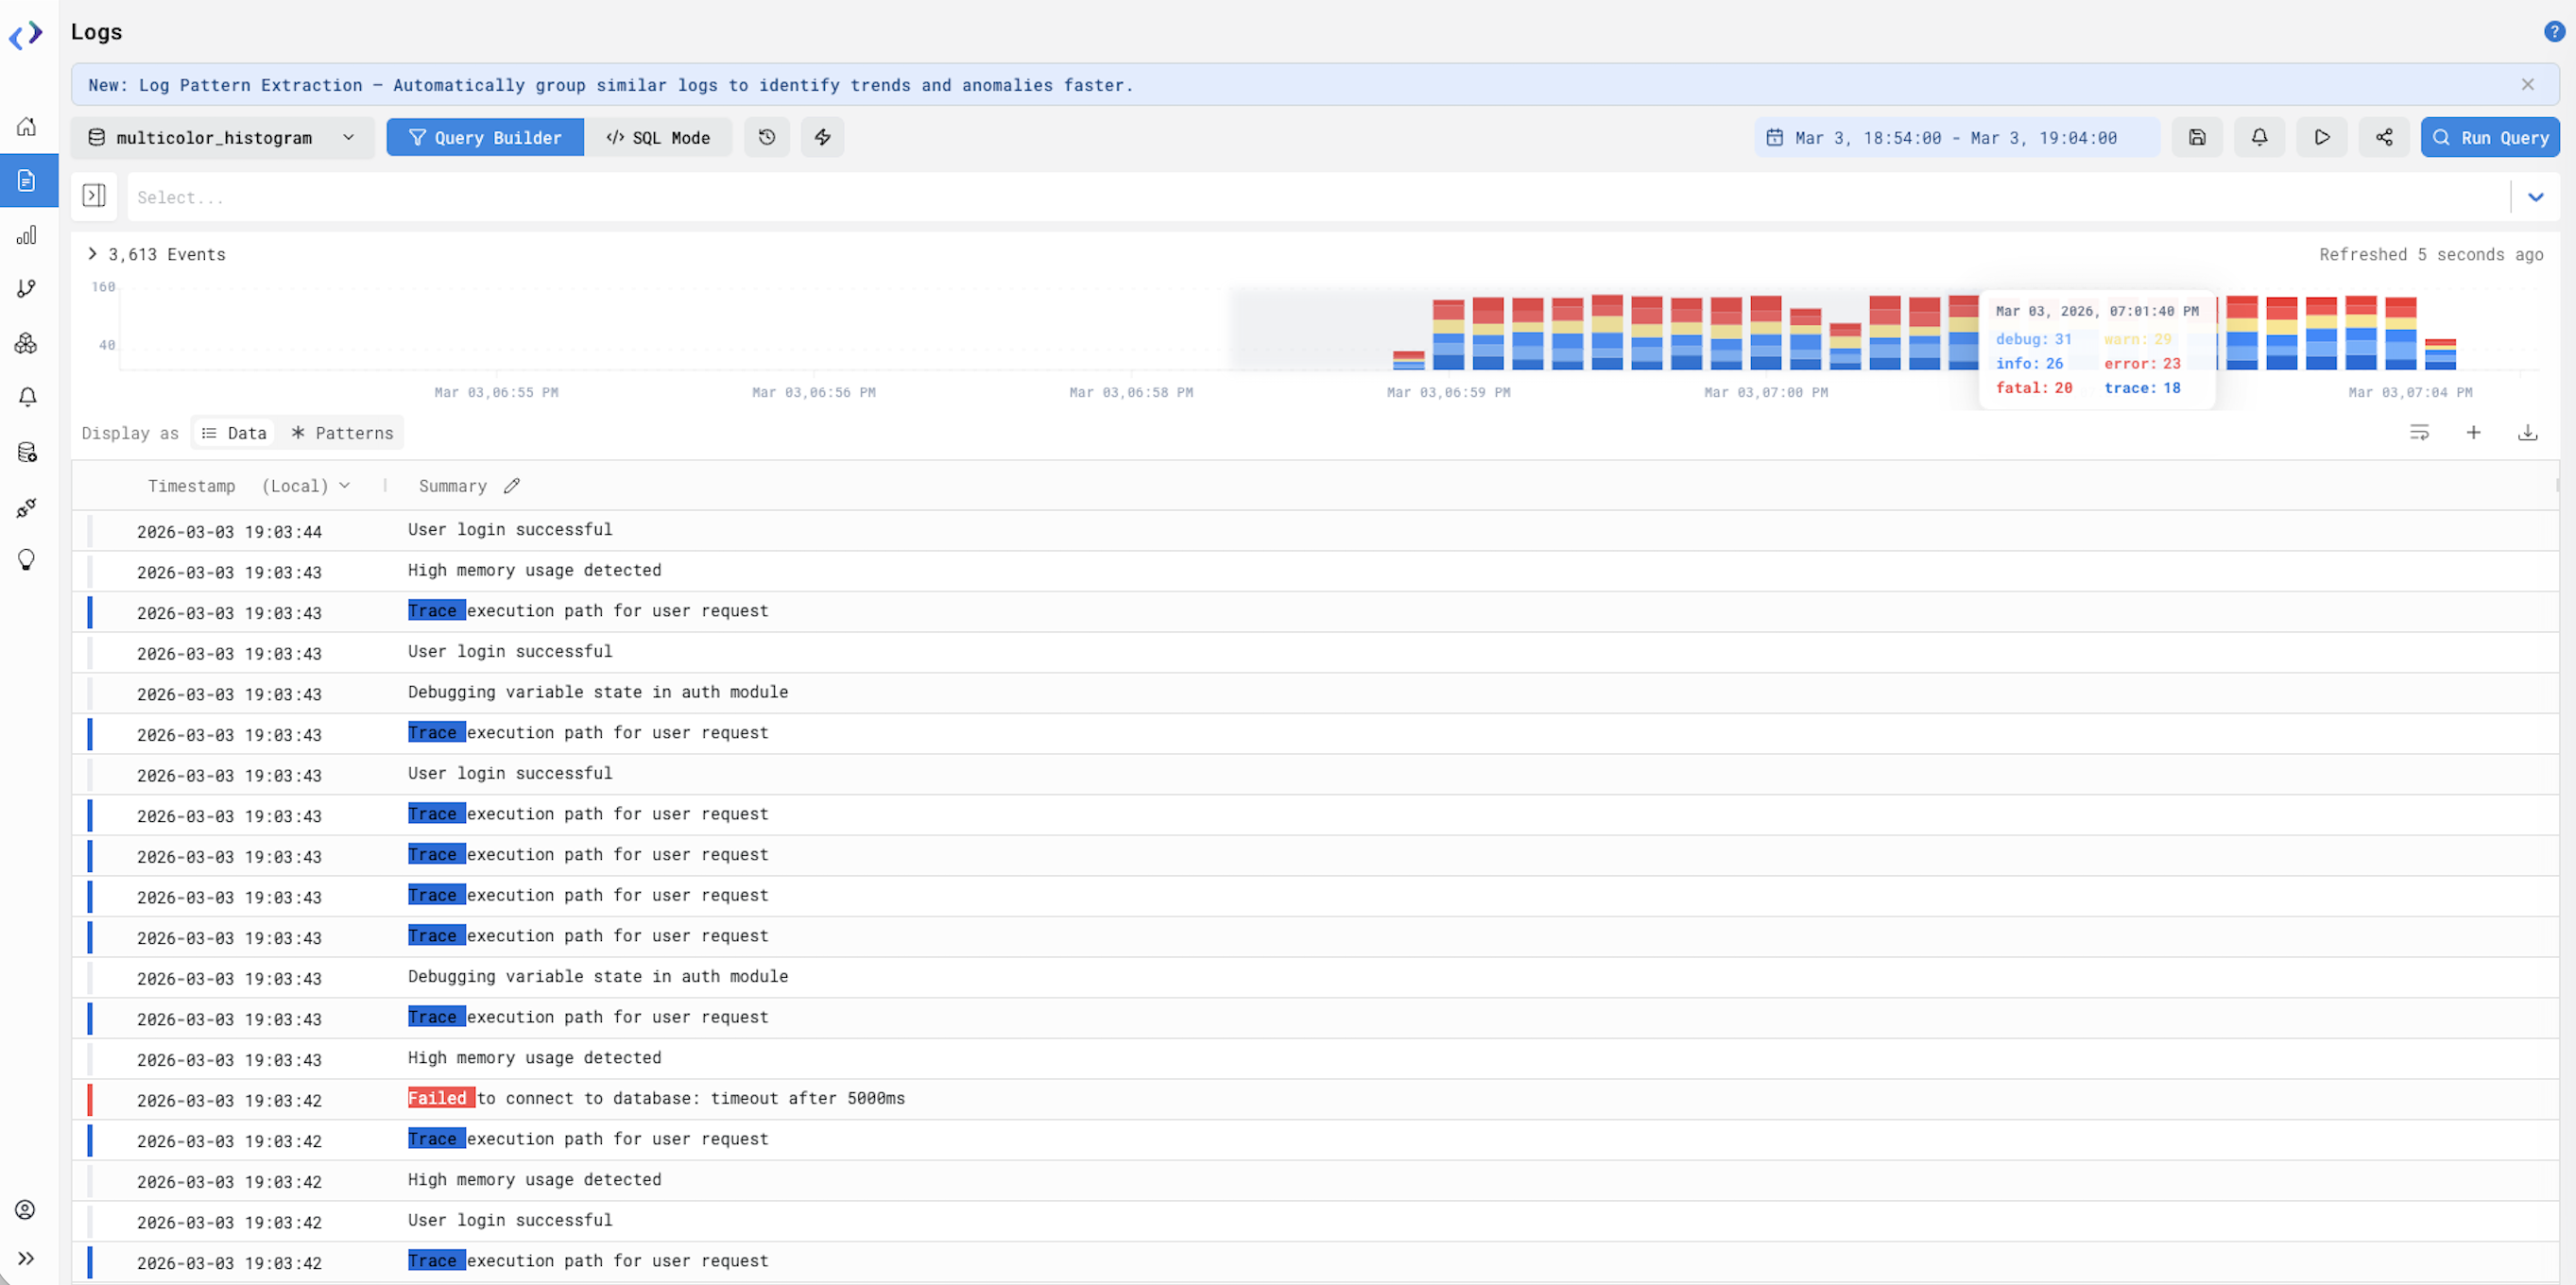
6. Multicolor Histogram
Spot severity patterns in logs briefly by color-coding histogram bars based on severity
- Below are the severity levels along with thier color coding
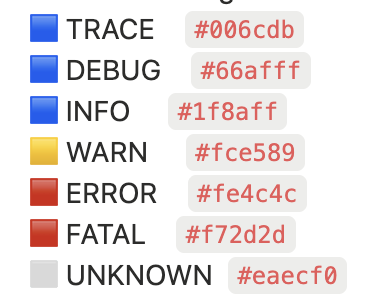
Note - Multicolor histogram requires your logs to include a severity field sent via OpenTelemetry. Logs without this field will continue to show a single-color histogram. `
Steps To Use
- Run any query on the Logs page
- Observe the histogram above the results where bars are segmented by severity
- Hover over any segment to view the severity wise count for that severity in the selected time bucket
- Click on a segment to filter logs by that severity and time range
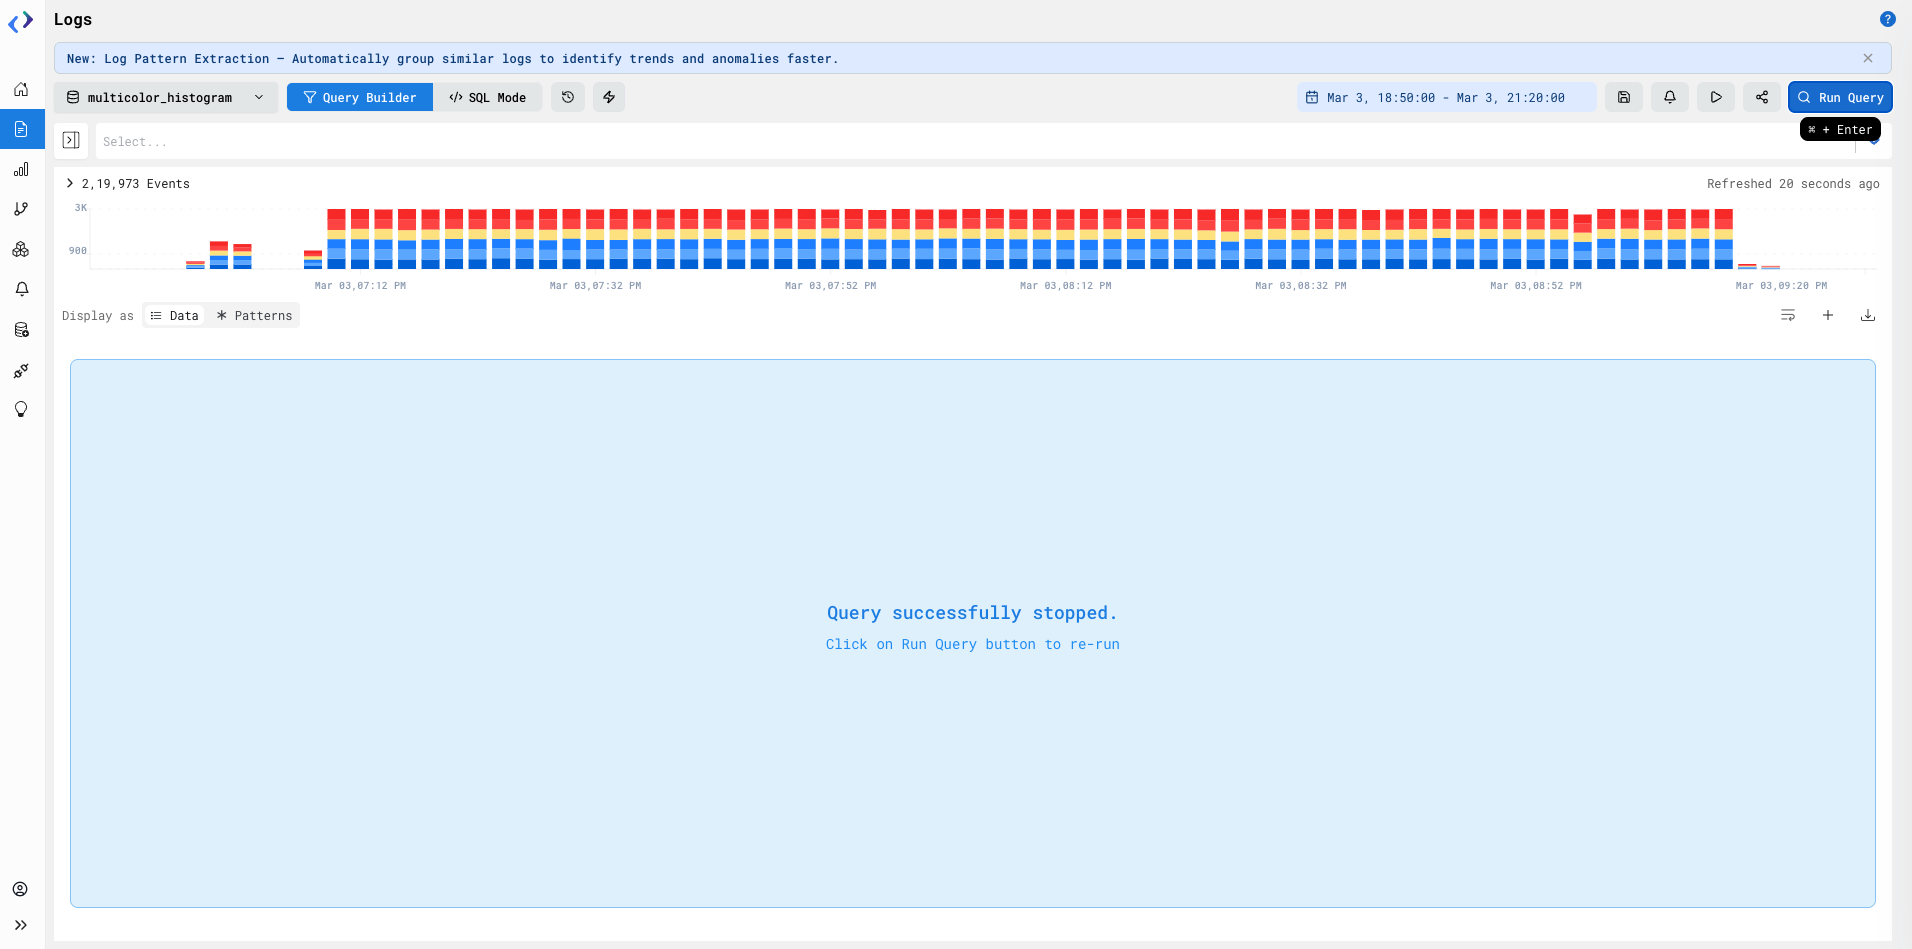
7. Stop Query
- If a particular query is taking longer time then to stop executing current query, click on 'Stop Query' button and execution will stop.
- Toast 'Query Successfully Stopped' will be shown.
- User can then change filters and click on 'Run Query' button again to Rerun.
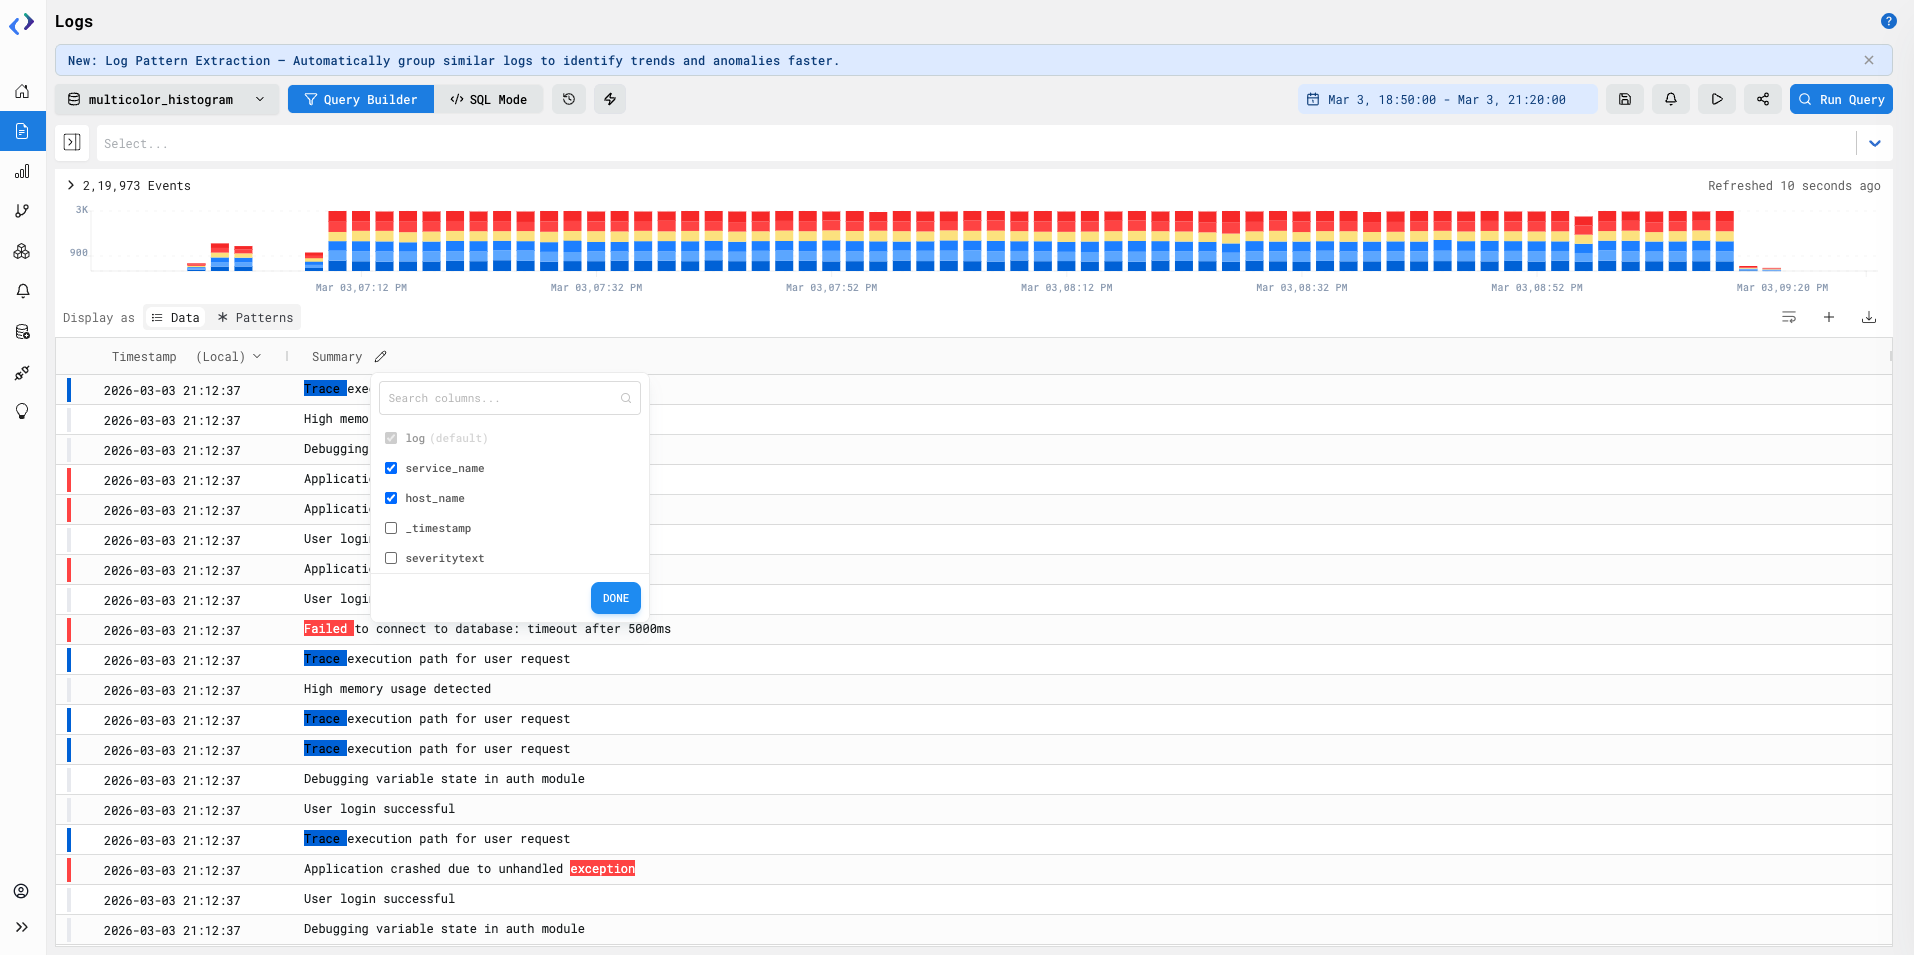
8. Log summary column
-
Users can create a log summary in the table by selecting most important attributes and available attribute will be shown (in order of selection).
-
The attributes can be selected from dropdown when clicked on pencil icon beside 'Summary' column.
-
Min 2 attributes must be selected for summary and at max 5 attributes can be selected.
9. Interactive Filtering on Histogram
- Drag on the bar graph to zoom in on a specific time range and view logs related to that period.
10. Expandable sidepanel
- The side panel can be expanded to give you more space to view your logs using the small blue icon at the edge of sidepanel.